E. Lamprecht’s MZ2SYNTH is a delightfully weird piece of code. It is an advanced wavetable synthesizer programmed only by an input image. Here’s an example:
Documentation is pretty sparse, so I’ve had to work it out as best I can:
input data must be a 720 px high NetPBM PPM or PGM image with a black background
waveforms are specified by pixel colour: sine, square, sawtooth and triangle are red, green, blue and luminance
dynamics are manipulated by changing the pixel brightness
the input plays at a constant rate along the horizontal pixels, defaulting to 10 pixels/second
The pitch is specified by the Y coordinate. To convert from MIDI note number n to an input coordinate for mz2synth, use this formula: y=6×(140 – n) So for Middle C (MIDI note 60), the Y coordinate would be 480.
I’ve created a very simple example that plays a C major scale with simple sine waves with no dynamics.
The input image:
The resulting audio:
And the python code that produced the image:
#!/usr/bin/env python3
# -*- coding: utf-8 -*-
# mz2-draw - draw a Cmaj scale in the right input format for mz2synth
# scruss, 2025-11
# mz2synth - https://github.com/frankenbeans/MZ2SYNTH
# command line:
#   mz2 -v -o mz2-cmaj.au mz2-cmaj.ppm

from PIL import Image, ImageDraw


# convert midi note number (20..127) to
# vertical offset for mz2 input
# notes < 20 (G#0) can't be played by mz2
def midi_to_y(n):
    return 6 * (140 - n)


middle_c = 60
maj_scale = (0, 2, 4, 5, 7, 9, 11, 12)
# maj_chord = (0, 4, 7)

# mz2 input must be 720 px high,
# preferably black bg
im = Image.new("RGB", (10 * len(maj_scale), 720), "black")
draw = ImageDraw.Draw(im)

for i, d in enumerate(maj_scale):
    # bright red lines mean full
    # volume sine waves
    draw.line(
        [
            10 * i,
            midi_to_y(middle_c + d),
            10 * i + 8,
            midi_to_y(middle_c + d),
        ],
        "red",
        1,
    )

# mz2 can only read NetPBM PPM format
im.save("mz2-cmaj.ppm")
Building
mz2synth comes with Windows and Mac OS binaries. To run the Mac code, you need Homebrew with the gcc@13 recipe. See this issue for details.
To build on Linux, you’ll need gfortran. A build script could be something like this:
git clone https://github.com/frankenbeans/MZ2SYNTH.git
cd MZ2SYNTH/SOURCE
make -f Makefile.gfortran
Put the resulting mz2 binary somewhere in your path, and that’s all the installation it needs. These same instructions should work for Mac OS.
If you really want to live on the edge (note: not really) and get a faster binary at the expense of array bounds checking, use this to recompile instead of the above make line:
this image is supposed to be made almost entirely of sextant blocks, the Unicode characters around U+1FB00 – U+1FB1E made out of two columns of three blocks. They’re originally from broadcast teletext, and were made to build low-resolution images on a text screen
Making the pixel to character map is quite tricky. The Sextant character block isn’t contiguous, and it’s not in the order we need. It’s also missing four characters: empty block, full block, left half block and right half block. These have to be pulled in from other Unicode blocks.
This is the map I came up with, from 0–63 with LSB at bottom right and MSB at top left:
NAPLPS — an almost-forgotten videotex vector graphics format with a regrettable pronunciation (/nap-lips/, no really) — was really hard to create. Back in the early days when it was a worthwhile Canadian initiative called Telidon (see Inter/Access’s exhibit Remember Tomorrow: A Telidon Story) it required a custom video workstation costing $$$$$$. It got cheaper by the time the 1990s rolled round, but it was never easy and so interest waned.
I don’t claim what I made is particularly interesting:
suspiciously canadian
but even decoding the tutorial and standards material was hard. NAPLPS made heavy use of bitfields interleaved and packed into 7 and 8-bit characters. It was kind of a clever idea (lower resolution data could be packed into fewer bytes) but the implementation is quite unpleasant.
A few of the references/tools/resources I relied on:
The 1983 BYTE Magazine article series NAPLPS: A New Standard for Text and Graphics. Also long and needlessly wordy, with digressions into extensions that were never implemented. Contains a commented byte dump of an image that explains most concepts by example
John Durno has spent years recovering Telidon / NAPLPS works. He has published many useful resources on the subject
Here’s the fragment of code I wrote to generate the NAPLPS:
#!/usr/bin/env python3
# -*- coding: utf-8 -*-
# draw a disappointing maple leaf in NAPLPS - scruss, 2023-09

# stylized maple leaf polygon, quite similar to
# the coordinates used in the Canadian flag ...
maple = [
    [62, 2],
    [62, 35],
    [94, 31],
    [91, 41],
    [122, 66],
    [113, 70],
    [119, 90],
    [100, 86],
    [97, 96],
    [77, 74],
    [85, 114],
    [73, 108],
    [62, 130],
    [51, 108],
    [39, 114],
    [47, 74],
    [27, 96],
    [24, 86],
    [5, 90],
    [11, 70],
    [2, 66],
    [33, 41],
    [30, 31],
    [62, 35],
]


def colour(r, g, b):
    # r, g and b are limited to the range 0-3
    return chr(0o74) + chr(
        64
        + ((g & 2) << 4)
        + ((r & 2) << 3)
        + ((b & 2) << 2)
        + ((g & 1) << 2)
        + ((r & 1) << 1)
        + (b & 1)
    )


def coord(x, y):
    # if you stick with 256 x 192 integer coordinates this should be okay
    xsign = 0
    ysign = 0
    if x < 0:
        xsign = 1
        x = x * -1
        x = ((x ^ 255) + 1) & 255
    if y < 0:
        ysign = 1
        y = y * -1
        y = ((y ^ 255) + 1) & 255
    return (
        chr(
            64
            + (xsign << 5)
            + ((x & 0xC0) >> 3)
            + (ysign << 2)
            + ((y & 0xC0) >> 6)
        )
        + chr(64 + ((x & 0x38)) + ((y & 0x38) >> 3))
        + chr(64 + ((x & 7) << 3) + (y & 7))
    )


f = open("maple.nap", "w")
f.write(chr(0x18) + chr(0x1B))  # preamble

f.write(chr(0o16))  # SO: into graphics mode

f.write(colour(0, 0, 0))  # black
f.write(chr(0o40) + chr(0o120))  # clear screen to current colour

f.write(colour(3, 0, 0))  # red

# *** STALK ***
f.write(
    chr(0o44) + coord(maple[0][0], maple[0][1])
)  # point set absolute
f.write(
    chr(0o51)
    + coord(maple[1][0] - maple[0][0], maple[1][1] - maple[0][1])
)  # line relative

# *** LEAF ***
f.write(
    chr(0o67) + coord(maple[1][0], maple[1][1])
)  # set polygon filled
# append all the relative leaf vertices
for i in range(2, len(maple)):
    f.write(
        coord(
            maple[i][0] - maple[i - 1][0], maple[i][1] - maple[i - 1][1]
        )
    )

f.write(chr(0x0F) + chr(0x1A))  # postamble
f.close()
There are a couple of perhaps useful routines in there:
colour(r, g, b) spits out the code for two bits per component RGB. Inputs are limited to the range 0–3 without error checking
coord(x, y) converts integer coordinates to a NAPLPS output stream. Best limited to a 256 × 192 size. Will also work with positive/negative relative coordinates.
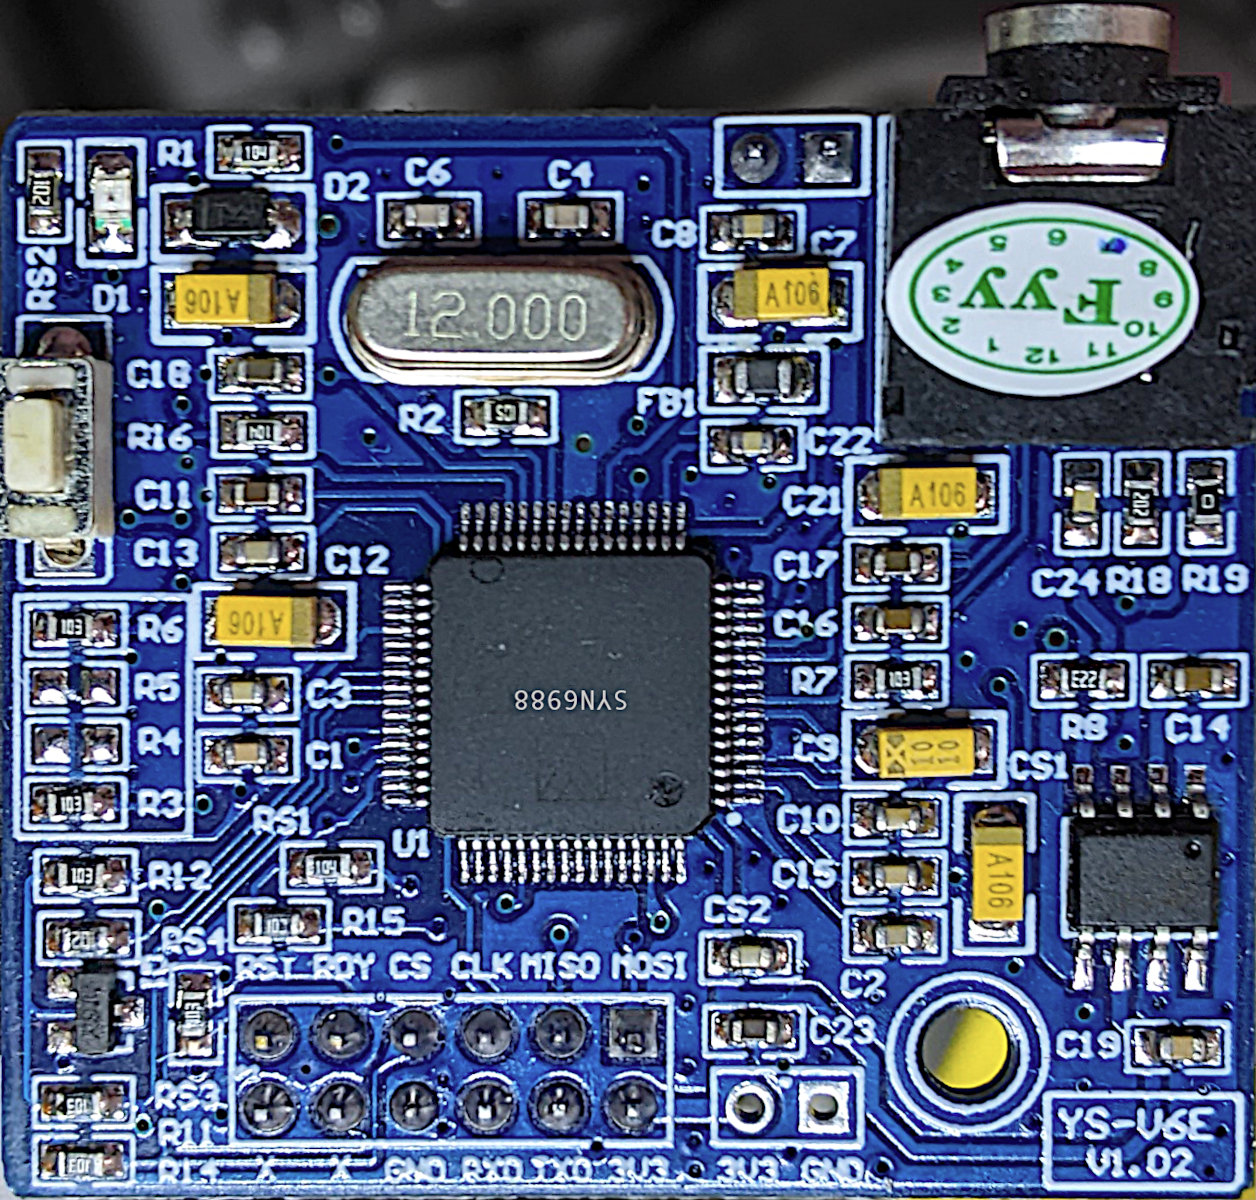
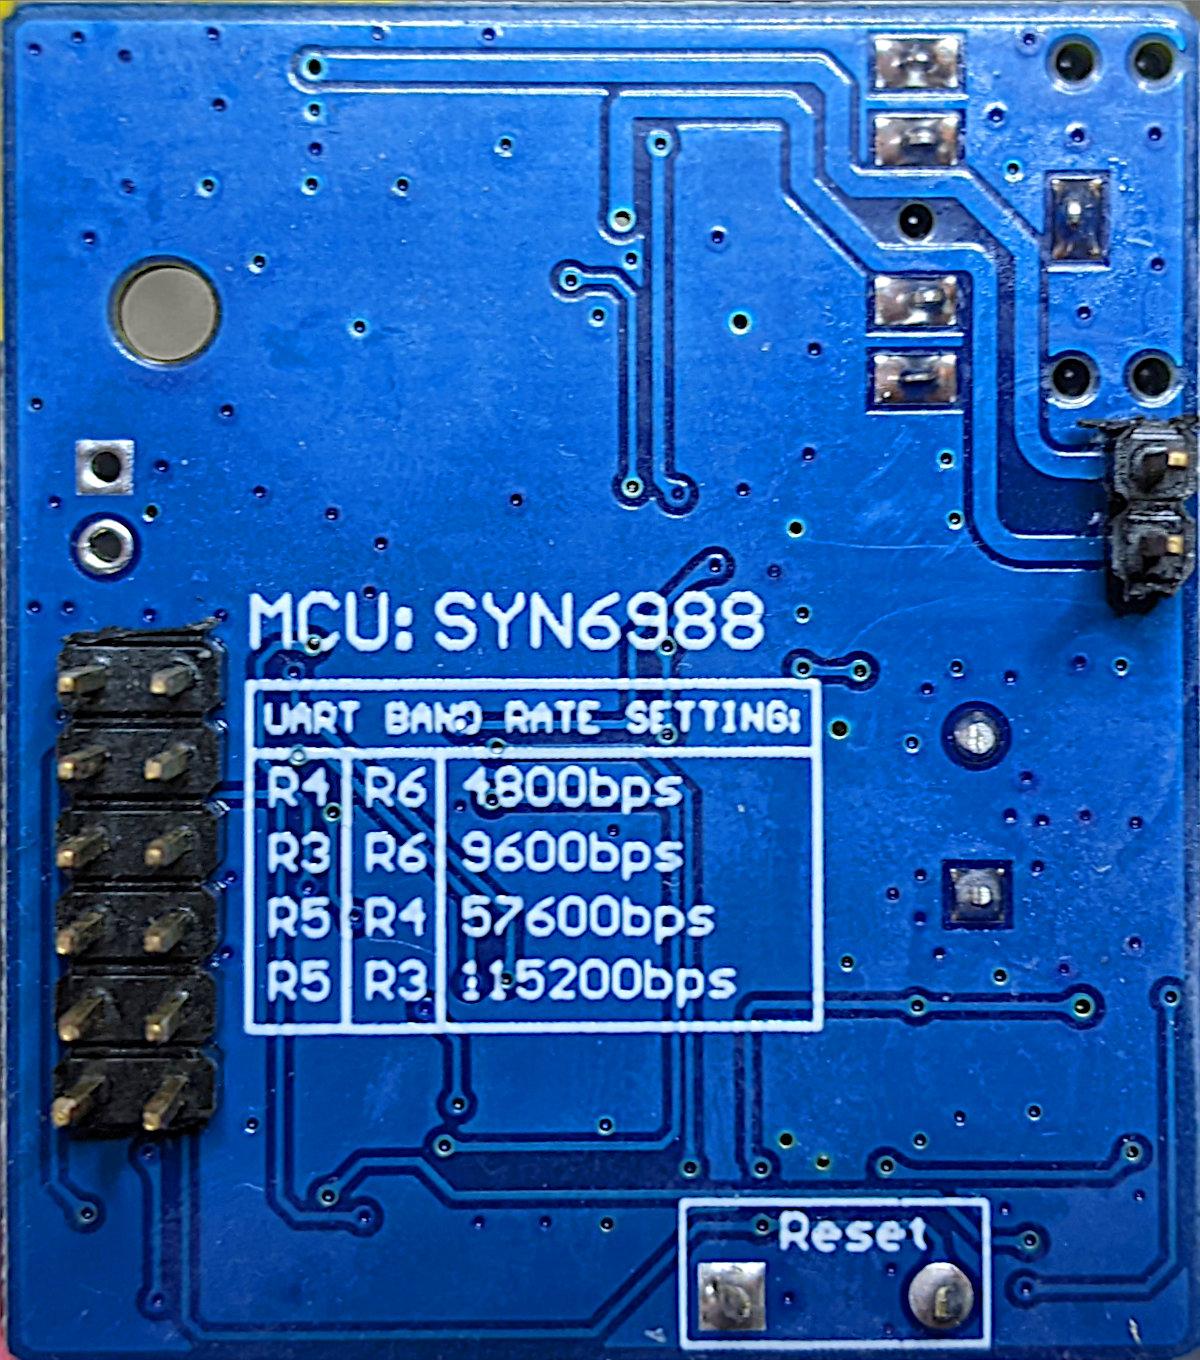
I’ve had one of these cheap(ish – $15) sound modules from AliExpress for a while. I hadn’t managed to get much out of it before, but I poked about at it a little more and found I was trying to drive the wrong chip. Aha! Makes all the difference.
Sensitive listener alert! There is a static click midway through. I edited out the clipped part, but it’s still a little jarring. It would always do this at the same point in playback, for some reason.
The only Pythonish code I could find for these chips was meant for the older SYN6288 and MicroPython (syn6288.py). I have no idea what I’m doing, but with some trivial modification, it makes sound.
I used the simple serial UART connection: RX -> TX, TX -> RX, 3V3 to 3V3 and GND to GND. My board is hard-coded to run at 9600 baud. I used the USB serial adapter that came with the board.
Here’s the code that read that text:
#!/usr/bin/env python3
# -*- coding: utf-8 -*-

import serial
import time

# NB via MicroPython and old too! Also for a SYN6288, which I don't have
# nabbed from https://github.com/TPYBoard/TPYBoard_lib/

def sendspeak(port, data):
    eec = 0
    buf = [0xFD, 0x00, 0, 0x01, 0x01]
    buf[2] = len(data) + 3
    buf += list(bytearray(data, encoding='utf-8'))
    for i in range(len(buf)):
        eec ^= int(buf[i])
    buf.append(eec)
    port.write(bytearray(buf))

ser = serial.Serial("/dev/ttyUSB1", 9600)
sendspeak(ser, "[t5]I like to think [p100](it [t7]has[t5] to be!)[p100] of a cybernetic ecology [p100]where we are free of our labors and joined back to nature, [p100]returned to our mammal brothers and sisters, [p100]and all watched over by machines of loving grace")
time.sleep(8)
ser.close()
This code is bad. All I did was prod stuff until it stopped not working. Since all I have to work from includes a datasheet in Chinese (from here: ??????-SYN6988???TTS????) there’s lots of stuff I could do better. I used the tone and pause tags to give the reading a little more life, but it’s still a bit flat. For $15, though, a board that makes a fair stab at reading English is not bad at all. We can’t all afford vintage DECtalk hardware.
The one thing I didn’t do is used the SYN6988’s Busy/Ready line to see if it was still busy reading. That means I could send it text as soon as it was ready, rather than pausing for 8 seconds after the speech. This refinement will come later, most likely when I port this to MicroPython.
Update, 2019-01: raspblocks.com appears to be dead, with an “Account Suspended” error from the host
Raspblocks is a new Blocks-based web programming environment for Raspberry Pi. You don’t even need to write the code on a Raspberry Pi, but the Python 3 code it produces will need to be transferred to a Raspberry Pi to run.
For maximum authenticity (and slowness), I fired up http://www.raspblocks.com/ on a Raspberry Pi Zero over VNC. It took a minute or more to load up the site in Chromium, but creating a simple program was all easy dragging and dropping:
The code it produced was pretty much exactly what you’d write by hand:
import RPi.GPIO as GPIO
import time
GPIO.setmode(GPIO.BCM)
GPIO.setup(26, GPIO.OUT)

while True:
    GPIO.output(26,True)
    time.sleep(1)
    GPIO.output(26,False)
    time.sleep(1)

And, as you might expect, the code make an LED connected to GPIO 26 turn on and off. Science!
Raspblocks isn’t as polished as its more established rival  EduBlocks, but Raspblocks doesn’t need any software installed. Edublocks installs its own Node.js-based web service, which would be painfully slow on a Raspberry Pi Zero. Raspblocks’ code needs to be run manually from a terminal, but I’d put up with that any day over having yet another Node server distribution installed under /opt.
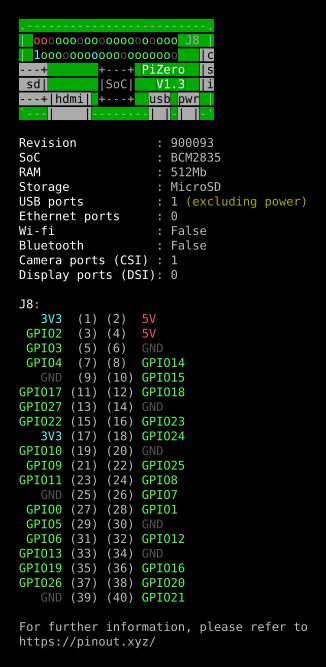
gpiozero (‘A simple interface to GPIO devices with Raspberry Pi’) continues to impress me. One of its newer features is a pinout guide, accessed by the pinout command:
Raspberry Pi Zero pinout – click through for PDF
I’m trying to resist running it on every generation of Raspberry Pi that I have (B, A, 2B, 3B, Zero, Zero W) just for these pretty displays.
(ANSI console colours captured using script, then fed through ansi2html [from the Ubuntu colorized-logs package], printed to PDF from Firefox then mucked about a bit with in Inkscape)
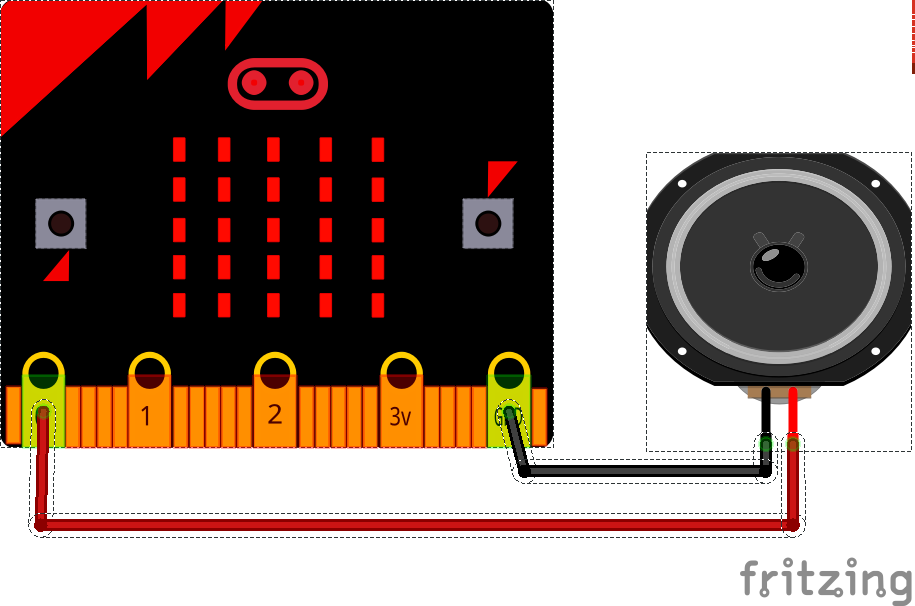
I just picked up a micro:bit, the little educational microprocessor board originally from the BBC. It’s a nice little unit, though like all educational resources, it’s sometimes hard to access resources as a non-edu type.
I landed upon MicroPython, a Python language subset that runs directly on the micro:bit’s ARM chip. I rather like the Mu editor: To give the old microcontroller grumps something real to complain about, MicroPython includes a bunch of very high-level functions, such as a powerful music and sound module. Getting the sound out is easy: just croc-clip a speaker onto the output pads:
(MicroPython warns against using a piezo buzzer as a speaker, but mine worked fine — loudly and supremely annoyingly — with a large piezo element. Some piezos have a fixed-frequency oscillator attached, but this simple one was great.)
This trivial example plays the Nyan Cat theme forever, but every time it loops it gets faster. The beats variable starts at the default 120 bpm, but is increased by one every time:
# nyan but it gets faster
import music
beats = 120
while True:
    music.set_tempo(bpm=beats)
    music.play(music.NYAN)
    beats = beats + 1
This starts out as merely irritating, but quite quickly becomes deeply annoying, and in mere hours become vastly vexing. I’m sure you’d only use this power for good …
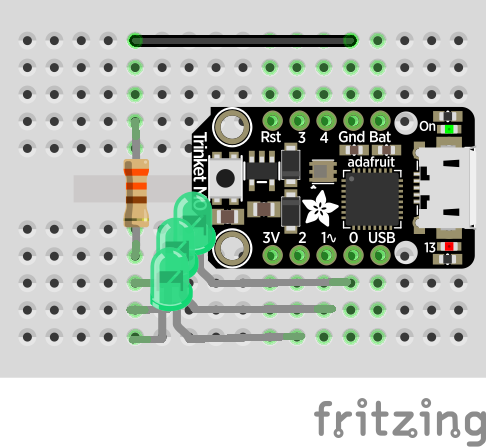
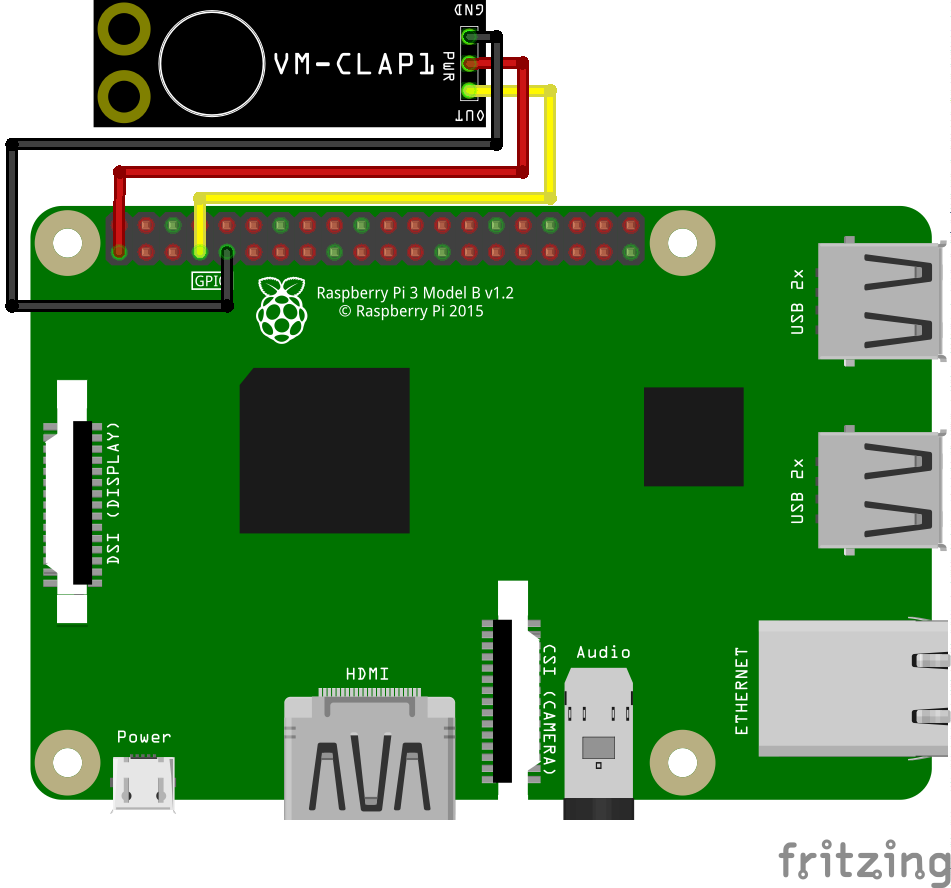
Since the Verbal Machines VM-CLAP1 sensor is an open collector type — that is, it sinks current when triggered — it behaves like a simple button to gpiozero, the Raspberry Pi Python GPIO library. If you attach a callback function to the sensor’s when_pressed event, your Python script will call that function every time it registers a clap.
The wiring is as simple as it could be:
 VM-CLAP1: Raspberry Pi:
 ========= =============
      GND → GND
      PWR → 3V3
      OUT → GPIO 4
This example code just prints clap! when the board picks up a ðŸ‘:
#!/usr/bin/env python3
# -*- coding: utf-8 -*-

# Raspberry Pi gpiozero test for
# Verbal Machines VM-CLAP1 clap sensor
#   scruss - 2017-06
#
# Wiring:
#
#  VM-CLAP1:    Raspberry Pi:
#  =========    =============
#    GND     →   GND
#    PWR     →   3V3
#    OUT     →   GPIO 4

from gpiozero import Button
from signal import pause

def clapping():
        print("clap!")

clap = Button(4)
clap.when_pressed = clapping
pause()
This is a trivial example, but at least it shows that anything you can do with a button, you can also do with this hand-clap sensor.
As Side Door sign v3 seemed to have fallen off, I needed to make a new one. With access to a laser cutter, I can make really permanent things now, so I designed this:
Yes, that’s a pointy thing filled with pointy things (all without thumbs, you’ll notice) and labelled with Cooper Black. Irony, much? Fe!
In order to get the sign to hang correctly, I needed to work out the centroid of the pointy outline. thedatachef/inkscape-centroid: Centroids for Inkscape paths and shapes to the rescue! Well, kinda. First off, the installer had a bug that said a Ruby file was a dependency when the plugin was in Python. So I forked the repo, made the change, tested it, and issued a pull request. So yay, working centroid calculations in Inkscape!
Secondly, the plugin only works well for simple shapes, like these:
But compound shapes? Not so well:
I guess it doesn’t like the negative moments generated by the holes, and does its own thing. Oh well.
Pen plotters were pretty expensive and complex pieces of electromechanical equipment. While they often earned their keep in the CAD office, they also had a function that’s almost forgotten: they could be used as input devices, too.
As a kid, we sometimes used to drive past the office of Ferranti-Cetec in Edinburgh. They specialized in digitizers: great big desk or wall mounted devices for capturing points from maps and drawings. Here’s one of their 1973 models:
While the technology and size have changed a bit, these huge bits of engineering kit are the ancestors of today’s track pads and touch screens.
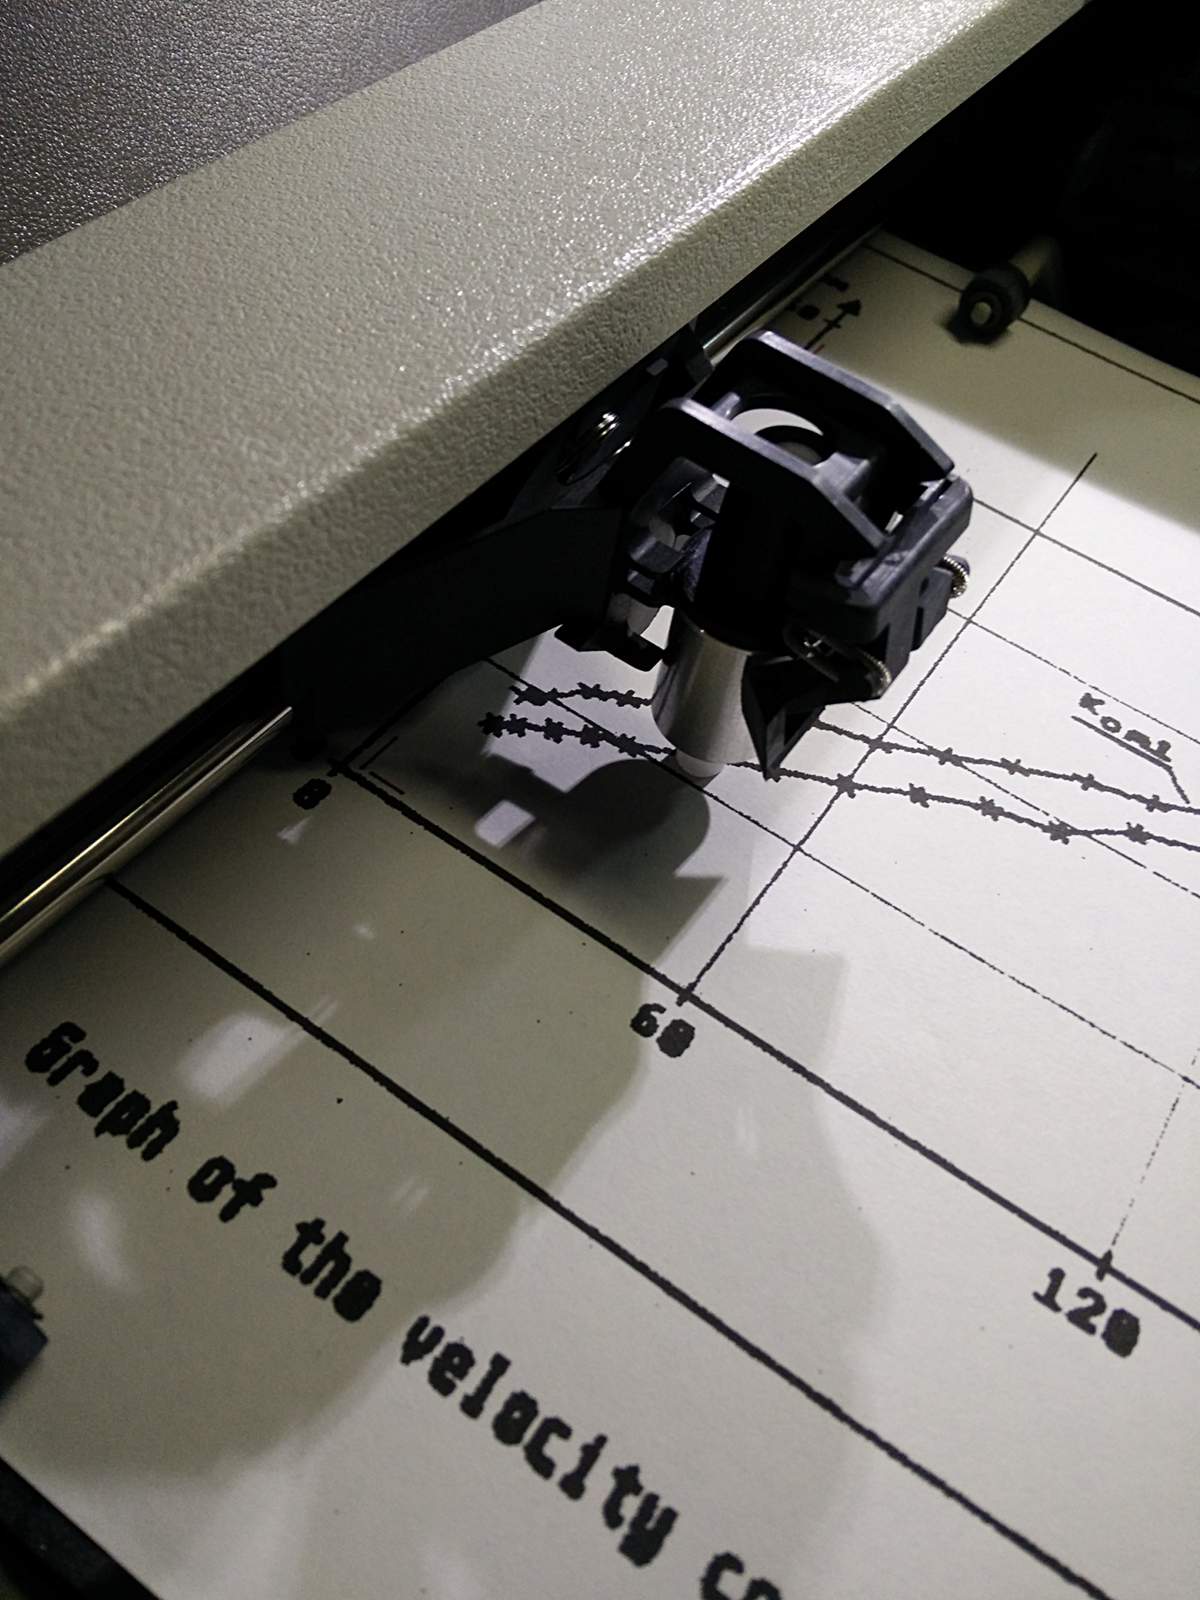
Realizing that their plotters had very precise X-Y indexing and that they had two-way communications to a computer, HP made a drafting sight that fitted in place of a pen on their plotters:
HP drafting sight, part no 09872-60066.
This is a very pleasing piece of kit, all metal, thick plastic and polished optical glass. They show up on eBay occasionally, and aren’t cheap. With a bit of coercion, it fits into my HP plotter like this:
Drafting sight in HP7470A plotter
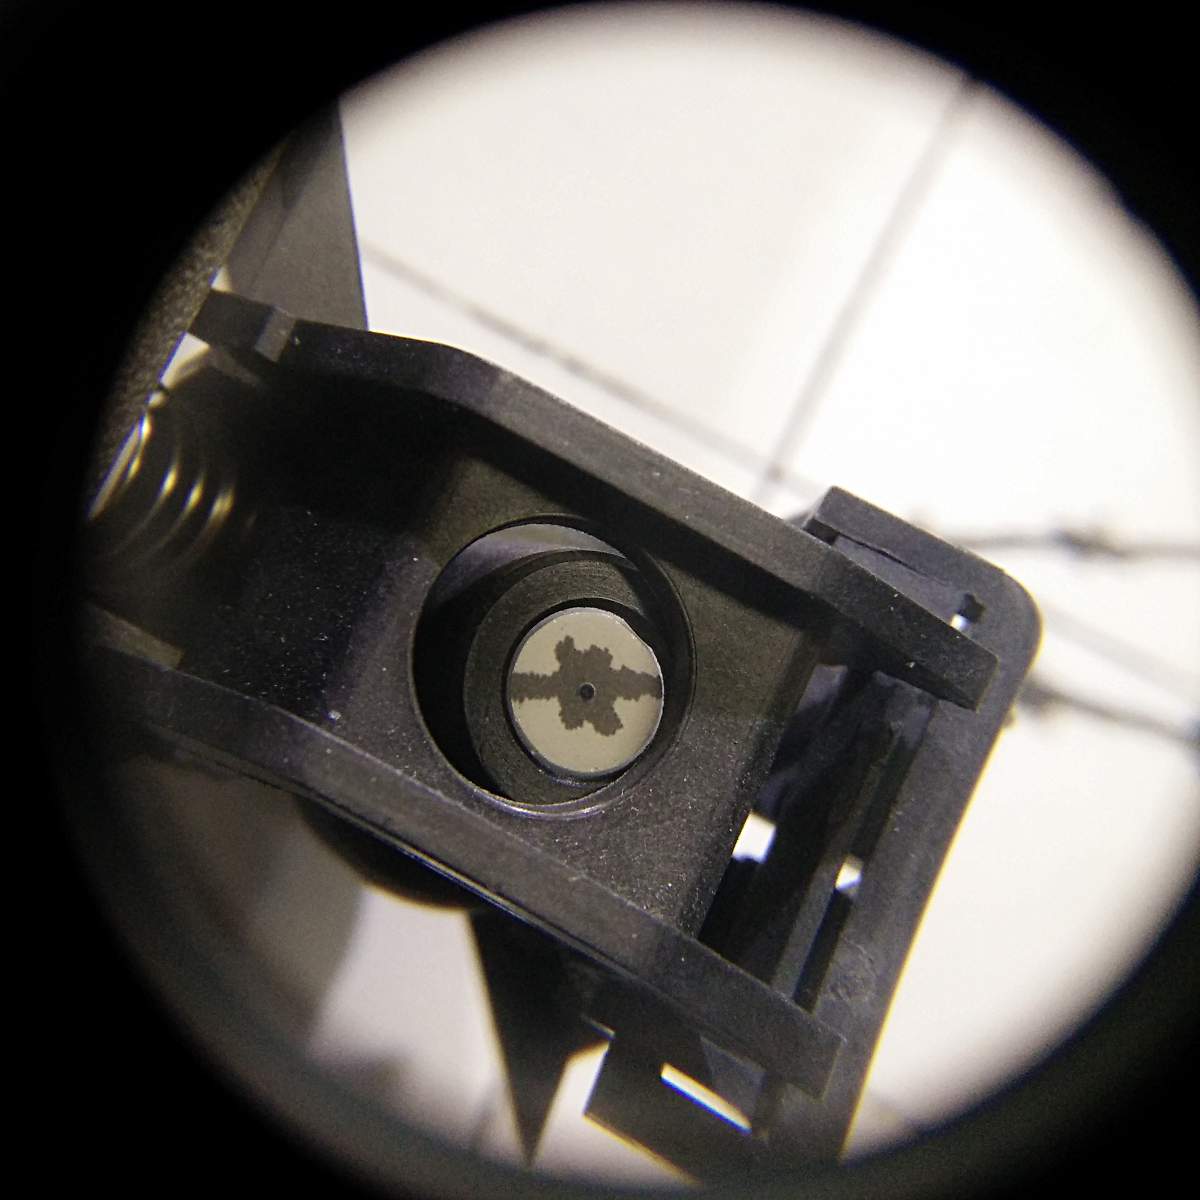
The image is very bright and clear:
Drafting sight near an axis labelDrafting sight over a point, showing cursor dot
If one has a digitizing sight, one needs to find something to digitize post haste. I’m sure everyone can sense the urgency in that. So I found this, a scan from my undergraduate project writeup (centrifugal pump impeller design ftw, or something), which was probably made on an Amiga or Atari ST:
It’s a graph, with pointy bits on it
I printed this as large as I could on Letter paper, as it’s the only size my HP7470A plotter can take. Now all it needed was a small matter of programming to get the data from the plotter. Here’s a minimally-useful digitizer for HP and compatible serial plotters. Although I ran it on my little HP grit wheel plotter attached to a Raspberry Pi, I developed it with my larger Roland plotter. The only fancy module it needs is pySerial.
#!/usr/bin/env python
# -*- coding: utf-8 -*-
# a really crap HP-GL point digitizer
#  scruss - 2016

from time import sleep
from string import strip
import serial

ser = serial.Serial(port='/dev/ttyUSB1', baudrate=9600, timeout=0.5)
lbl = ''
points = []
labels = []
k = 0
retval = 0

ser.write('DP;')                # put in digitizing mode
while lbl != 'quit':
    ser.write('OS;')
    ret = strip(ser.read(size=5), chr(13))
    print ('Retval: ', ret)
    if ret != '':
        retval = int(ret)
    if retval & 4:              # bit 2 is set; we have a point!
        print ('Have Point! Retval: ', retval)
        retval = 0
        ser.write('OD;')
        pt = strip(ser.read(size=20), chr(13))
        print ('OD point: ', pt)
        lbl = raw_input('Input label [quit to end]: ')
        points.append(pt)
        labels.append(lbl)
        k = k + 1
        ser.write('DP;')        # put in digitizing mode again
    sleep(1)
ser.close()

f = open('digit.dat', 'w')
for i in range(k):
    f.write(points[i])
    f.write(',')
    f.write(labels[i])
    f.write('\n')
f.close()
In the unlikely event that anyone actually uses this, they’ll need to change the serial port details near the top of the program.
The program works like this:
Move the drafting sight to the point you want to capture using the plotter’s cursor keys, and hit the plotter’s ENTER key
Your computer will prompt you for a label. This can be anything exceptquit, that ends the program
When you have digitized all the points you want and entered quit as the last label, the program writes the points to the file digit.dat
I didn’t implement any flow control or other buffer management, so it can crash in a variety of hilarious ways. I did manage to get it to work on the lower trace of that graph, and got these data:
The first two columns are X and Y, in HP-GL units — that’s 1/40 mm, or 1/1016 inches. The third column will always be 1 if you have the sight down. The last columns are the label; if you put commas in them, opening the file as CSV will split the label into columns. I used it to fudge axis points. You’ll also note that the last three lines of data are my valiant attempts to quit the program.
Assuming the axes are not skewed (they are, very slightly, but shhh) some simple linear interpolation gives you the results below:
(For prettier things to do with plotter digitizing commands, Ed Nisley KE4ZNU has made some rather lovely Superformula patterns)
If you don’t have a plotter, or even if you do and you don’t have hours to waste mucking about with Python, obsolete optics and serial connections, Ankit Rohatgi’s excellent WebPlotDigitizer (or Engauge, as I found out when this article hit HackerNews in 2021) gets numbers out of graphs quickly. It handles all sorts of graphs rather well.
Update, 2025: eek, but WebPlotDigitizer is now login-only and has been infested by AI shite. Run away now, run away fast … or try to find an old mirror online, such as WebPlotDigitizer at utk.edu.
The cryptically-named q (it also bills itself as being able to “Run SQL directly on CSV files | Text as Dataâ€) is very nifty indeed. It allows you to run SQL queries on delimited text files. It seems to support the full SQLite SQL dialect, too.
The first problem is that the file uses nasty date formats. Today would be 23-Jan-16 in the report’s Date field, which is filled with the ugh. You can fix that, though, with a fragment of SQL modified from here:
The above data definition sets the isodate column to be in the familiar and useful YYYY-MM-DD ISO format.
A related example would be to query the whole CSV file for monthly mean generation from Kingsbridge and K2 Wind projects (they’re next to one another) for months after K2’s commissioning in March 2015. Here’s what I did in q:
q -T -O -H -d, 'select printf("%4d-%02d", substr(Date, 8,2)+2000, (instr("---JanFebMarAprMayJunJulAugSepOctNovDec", substr(Date, 4,3))-1)/3) as isomonth, avg(KINGSBRIDGE) as kavg, avg(K2WIND) as k2avg from Downloads/HourlyWindFarmGen_20160122.csv where isomonth>"2015-03" group by isomonth'
which gave the results:
isomonth   kavg   k2avg
2015-04Â Â Â 12.7277777778Â Â Â 37.4569444444
2015-05Â Â Â 8.94623655914Â Â Â 67.6747311828
2015-06Â Â Â 6.05833333333Â Â Â 66.6847222222
2015-07Â Â Â 3.96370967742Â Â Â 45.372311828
2015-08Â Â Â 6.34811827957Â Â Â 67.436827957
2015-09Â Â Â 7.29027777778Â Â Â 79.7194444444
2015-10Â Â Â 14.5658602151Â Â Â 128.037634409
2015-11Â Â Â 15.9944444444Â Â Â 130.729166667
2015-12Â Â Â 17.6075268817Â Â Â 152.422043011
2016-01Â Â Â 19.6408730159Â Â Â 163.013888889
Over the last few weeks, I’ve been playing with a few small thermal printers. Meant as POS or information booth printers, they make a diverting project for the lo-fi printing enthusiast. While they all have common features — 58 mm/2¼” paper width, 8 pixel/mm resolution, 48 mm print width, serial connection — they all have their quirks. You may have seen these sold as the Adafruit Mini Thermal Receipt Printer or Sparkfun’s Thermal Printer, but there are many others. I’m going to write more on interfacing these directly to Raspberry Pi, Arduino, and (if I can navigate the documentation) a CUPS driver.
For now, I’m just leaving you a list of things I’ve found helpful for the DP-EH600 and 701 printers. Note that the similar-looking BTHT-v6 printer uses a completely different command set.
Replacement paper is sold as 2¼” — 30′. Staples have a box of 30 rolls for under $25 (item 279096, not on their website). Longer rolls don’t fit.
You’ll need a USB→TTL Serial adapter, preferably one with DTR control. I use one from JY-MCU. In a pinch, you can use a simpler Debug / Console Cable for Raspberry Pi, but you risk serial overruns and dodgy results. Remember that RX on the adapter goes to TX on the printer, and vice versa.
A good solid power supply is needed; these printers draw ~8 W when printing. Some printers only support 5 V (for which a 3 amp adapter would be ideal), others 5-9 V. The higher voltage makes text printing faster. You can’t drive these directly from your Raspberry Pi/Arduino power supply.
Linux serial ports are set to some defaults which may have been historically useful, but now corrupt 8-bit data. A trick I picked up here is to first issue the command stty -F /dev/ttyUSB1 0:0:0:0:0:0:0:0:0:0:0:0:0:0:0:0:0:0:0:0:0:0:0:0:0:0:0:0:0:0:0:0:0:0:0:0
which clears all settings, then set the device up as you need it: stty -F /dev/ttyUSB1 speed 9600 raw cs8
(Most of these printers default to 9600 baud. Your device may be called something different to ttyUSB1.)
I’ve written a couple of Python driver stubs which take an image and produce the relevant binary output:
scruss / esc-pos-image.py – prints an image as a single command. May not work on the SparkFun printer. Does not work on the BTHT-v6.
scruss / esc-pos-image-star.py – prints the image in 24 pixel deep bands. Can sometimes cause visible gaps in the printout, but will work on almost all printers, except the BTHT-v6.
These Python libraries also work, as long as you address the printer properly (right device, right speed):
python-escpos – image support limited to 255 pixels high, for some reason.
Reed Zhao (of Tangram Software) lent me a couple of different printers for testing after I bought a different one from him. He’s put a lot of work into sourcing these printers direct from the manufacturers. Thanks, Reed! NB: Reed doesn’t sell printers any more. Try eBay.
BTHT-V6 manual (Chinese) — probably just enough info to follow the wiring and some of the basic control codes. Looks like the one I had was 5V only, so needs a 5V 3A power supply.
Hey! This post is completely ancient. It doesn’t even use Python 3. Advice given here might be well out of date.
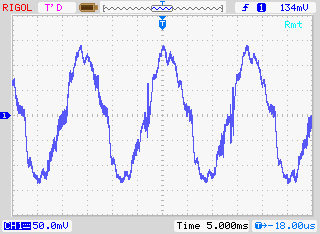
… it complains that the oscilloscope is always making waves.
Ahem. Anyway. I have a Rigol DS1102E 100 MHz Digital Oscilloscope. For such a cheap device, it’s remarkable that you can control it using USB Test & Measurement Class commands. I’d been wanting to use a Raspberry Pi as a headless data acquisition box with the oscilloscope for a while, but Raspbian doesn’t ship with the usbtmc kernel module. I thought I was stuck.
Alex Forencich turned up in the forum with an all-Python solution: Python USBTMC (source: alexforencich / python-usbtmc). I got this working quite nicely today on both the Raspberry Pi and my Ubuntu laptop. Here’s how I installed it:
Check your device’s USB code with lsusb: $ lsusb Bus 001 Device 002: ID 0424:9512 Standard Microsystems Corp. …. Bus 001 Device 004: ID 1ab1:0588 Rigol Technologies DS1000 SERIES
Ensure that libusb-1.0 is installed: sudo apt-get install libusb-1.0-0
Create a new group, usbtmc: sudo groupadd usbtmc
Add yourself to this group: sudo usermod -a -G usbtmc pi
As root, create a file /etc/udev/rules.d/usbtmc.rules. You’ll need to put in your device’s ID values: # USBTMC instruments # Rigol DS1100 – ID 1ab1:0588 Rigol Technologies DS1000 SERIES SUBSYSTEMS==”usb”, ACTION==”add”, ATTRS{idVendor}==”1ab1″, ATTRS{idProduct}==”0588″, GROUP=”usbtmc”, MODE=”0660″
(all of the SUBSYSTEMS to MODE= should be one one line)
Download and install the latest pyusb (Raspbian version is rather old): git clone https://github.com/walac/pyusb.git cd pyusb python setup.py build sudo python setup.py install
Now get python-usbtmc: git clone https://github.com/alexforencich/python-usbtmc.git cd python-usbtmc python setup.py build sudo python setup.py install
For this simple demo, you’ll need to convert the USB vendor IDs to decimal: 0x1ab1 = 6833 0x0588 = 1416
Now, start python as root (sudo python) then type: import usbtmc instr =Â usbtmc.Instrument(6833, 1416) print(instr.ask(“*IDN?”))
This should return something like: Rigol Technologies,DS1102E,DS1EB13490xxxx,00.02.06.00.01
If you get the status line, congratulations! You now have a fully working usbtmc link. I haven’t had much time to play with this, but I know I can make really nice screenshots to an attached USB drive using the command: instr.write(“:HARDcopy”). Many more commands can be found in the DS1000D/E Programming Guide, available on Rigol‘s site.
I had a couple of problems, though:
The library seems to need root privileges, despite the udev rule thing. After creating the udev rule, you will need to reboot. This is the simplest way of getting it to work without being root.
Reading from the ‘scope’s memory chokes on non-UTF8 characters. If I do: rawdata = instr.ask(“:WAV:DATA? CHAN1”)[10:] I get a lengthy Python error which ends: … File “/usr/lib/python2.7/encodings/utf_8.py”, line 16, in decode    return codecs.utf_8_decode(input, errors, True) UnicodeDecodeError: ‘utf8’ codec can’t decode byte 0x99 in position 10: invalid start byte I have no idea what that means, or how to fix it. Alex suggested using ask_raw instead of ask, and the data comes through with no complaints.
I’ve still got to work my way through the Rigol’s data format, but other people have done that before:
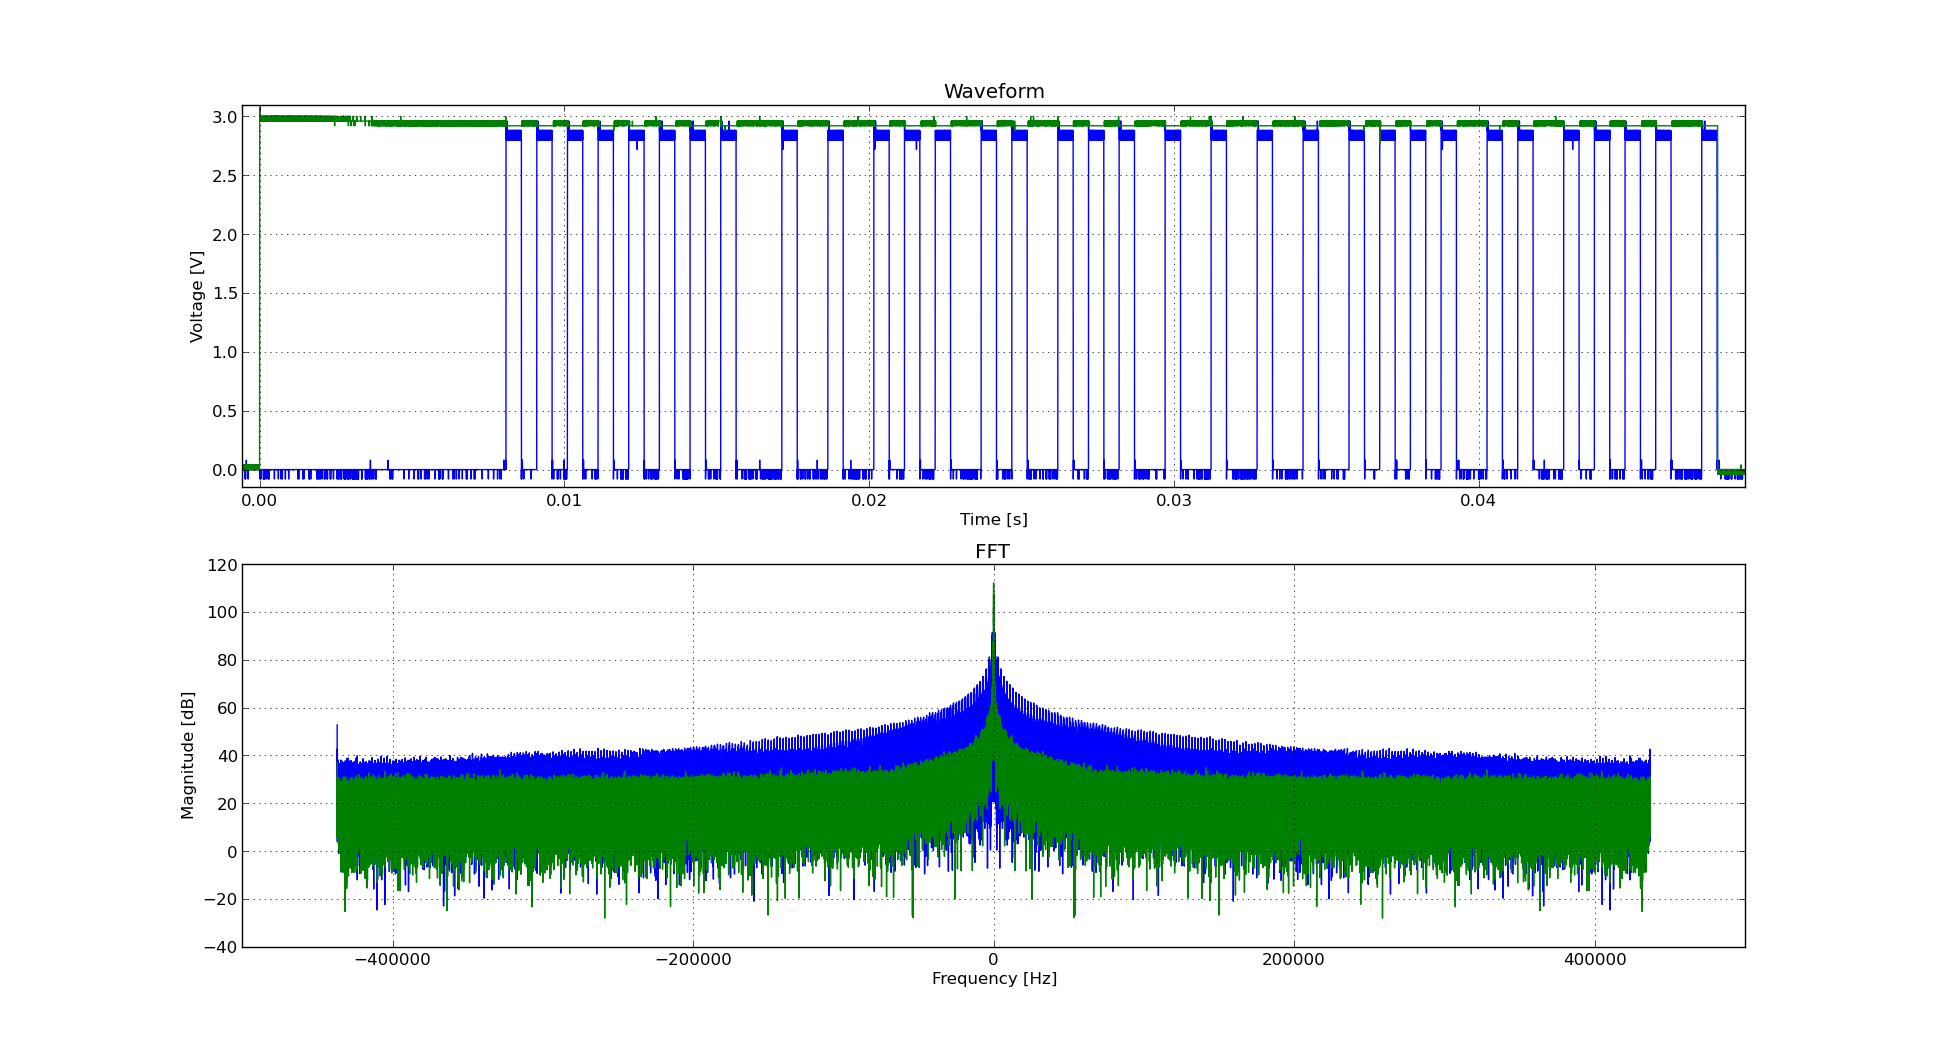
Incidentally, if you’re working with WFM data dumps from the Rigol ‘scopes (and you should, because they make storing data to USB drives quick), mabl/pyRigolWFM is basically magic. Not merely can it describe and decode those binary files, it can do pretty graphics with no thought required:
Update, 2013-12-20: I’ve successfully managed to run most of Ken’s examples with Alex’s code. The major modification you have to do is use ask_raw instead of ask. Example code shown below:
#!/usr/bin/python
# -*- coding: utf-8 -*-
"""
Download data from a Rigol DS1102E oscilloscope and graph with matplotlib
using Alex Forencich's python-usbtmc pure python driver
https://github.com/alexforencich/python-usbtmc
scruss - 2013-12-20
based on
Download data from a Rigol DS1052E oscilloscope and graph with matplotlib.
By Ken Shirriff, http://righto.com/rigol
which in turn was
Based on http://www.cibomahto.com/2010/04/controlling-a-rigol-oscilloscope-using-linux-and-python/
by Cibo Mahto.
"""
import usbtmc
import time
import numpy
import matplotlib.pyplot as plot
# initialise device
instr = usbtmc.Instrument(0x1ab1, 0x0588) # Rigol DS1102E
# read data
instr.write(":STOP")
instr.write(":WAV:POIN:MODE RAW")
# first ten bytes are header, so skip
rawdata = instr.ask_raw(":WAV:DATA? CHAN1")[10:]
data_size = len(rawdata)
# get metadata
sample_rate = float(instr.ask_raw(':ACQ:SAMP?'))
timescale = float(instr.ask_raw(":TIM:SCAL?"))
timeoffset = float(instr.ask_raw(":TIM:OFFS?"))
voltscale = float(instr.ask_raw(':CHAN1:SCAL?'))
voltoffset = float(instr.ask_raw(":CHAN1:OFFS?"))
# show metadata
print "Data size: ", data_size
print "Sample rate: ", sample_rate
print "Time scale: ", timescale
print "Time offset: ", timeoffset
print "Voltage offset: ", voltoffset
print "Voltage scale: ", voltscale
# convert data from (inverted) bytes to an array of scaled floats
# this magic from Matthew Mets
data = numpy.frombuffer(rawdata, 'B')
data = data * -1 + 255
data = (data - 130.0 - voltoffset/voltscale*25) / 25 * voltscale
# creat array of matching timestamps
time = numpy.linspace(timeoffset - 6 * timescale, timeoffset + 6 * timescale,
num=len(data))
# scale time series and label accordingly
if (time[-1] &lt; 1e-3):
time = time * 1e6
tUnit = "µS"
elif (time[-1] &lt; 1):
time = time * 1e3
tUnit = "mS"
else:
tUnit = "S"
# Plot the data
plot.plot(time, data)
plot.title("Oscilloscope Channel 1")
plot.ylabel("Voltage (V)")
plot.xlabel("Time (" + tUnit + ")")
plot.xlim(time[0], time[-1])
plot.show()
Boodler is rather fun. It generates ambient music based on user-defined or downloaded ‘soundscapes’. If you’ve got a modern (HTML5/Opus-capable) browser, you can hear a streaming demo here: http://repeater.xiph.org:8000/clock.opus. It’s using the FM3 Buddha Machine samples in this demo, but it can run lots more: a tree full of crows, a thunderstorm, dripping water, …
It’s pretty easy to run on a Raspberry Pi running a recent version of Raspbian. The only technical glitch I had was that there’s something deeply confused about ALSA sound handling on the Raspberry Pi. I’m sure it’ll get fixed soon, but for now, you have to use PulseAudio. (If you want to read about my ALSA woes, go here.)
It takes a while to do this, but make sure it does something useful when it’s building the various sound drivers. You don’t want it to say:
skipping 'boodle.cboodle_pulse' extension
If it says that, you haven’t installed Pulseaudio. Go back and check your apt-get line.
Once it’s built, now install it:
sudo python setup.py install
Now test it:
boodler --hardware --output pulse --testsound
Not merely should you get some pleasant tones from your Raspberry Pi’s audio, but you sound get some informative and non-threatening terminal output. Mine looks like:
Boodler: PulseAudio sound driver.
 PulseAudio library: 2.0.0.
 Sample rate is 44100 fps.
 Samples are 16-bit little-endian.
 Buffer size is 32768.
 21:37:46 (root) Running "Boodler test sound"
If that works, let’s get those crows a-cawin’. Download the soundscapes you need:
Boodler has tons of options, prebuilt packages, and instructions to build your own: Boodler Documentation.
One thing I’ve tried to get working, but failed, is streaming from Boodler via icecast. Sure, I can install and run it, it’s just that the results are, um, undesirable. If you want to have a play, here’s how to install icecast:
sudo apt-get install icecast2 ices2 libshout3-dev
Icecast will configure itself, and ask for a couple of passwords. You’ll have to rebuild and reinstall Boodler for it to catch the new configuration. You can then try streaming:
If you open a web browser at this address http://raspberrypi:8000/ you should see a config page listing your boodler-buddha.ogg stream. Click on the M3U link next to it, and your streaming music player should start making a joyful noise …
… except in my case, something went very wrong, and it started to produce industrial ultra-glitch nightmare noise: boodler-streaming_test-fail. I’m sure it’s fixable with some tweaking, but I’m not there yet.
Hey! This is a really old article. You should really be using gpiozero these days.
I hadn’t realised it, but the The Quite Rubbish Clock did something that a lot of people seem to have trouble with on the Raspberry Pi: communicating using hardware SPI. Perhaps it’s because everything is moving so fast with Raspberry Pi development, tutorials go out of date really quickly. Thankfully, hardware SPI is much easier to understand than the older way of emulation through bit-banging.
SPI is a synchronous serial protocol, so it needs a clock line as well as a data in and data out line. In addition, it has a Chip Enable (CE, or Chip Select, CS) line that is used to choose which SPI device to talk to. The Raspberry Pi has two CE lines (pins 24 and 26) so can talk to two SPI devices at once. It supports a maximum clock rate of 32 MHz, though in practice you’ll be limited to the rate your device supports.
The device I’m testing here is an MCP3008 10-bit Analogue-to-Digital Converter (ADC). These are simple to use, cheap and quite fast converters with 8 input channels. If you hook them up to a 3.3 V supply they will convert a DC voltage varying from 0-3.3 V to a digital reading of 0-1023 (= 210 – 1). Not quite up there in quality for hi-fi audio or precision sensing, but good enough to read from most simple analogue sensors.
The sensor I’m reading is the astonishingly dull LM35DZ temperature sensor. All the cool kids seem to be using TMP36s (as they can read temperatures below freezing without a negative supply voltage). One day I’ll show them all and use a LM135 direct Kelvin sensor, but not yet.
The code I’m using is a straight lift of Jeremy Blythe’s Raspberry Pi hardware SPI analog inputs using the MCP3008. The clever bit in Jeremy’s code is the readadc() function which reads the relevant length of bits (by writing the same number of bits; SPI’s weird that way) from the SPI bus and converting it to a single 10-bit value.
#!/usr/bin/python
# -*- coding: utf-8 -*-
# mcp3008_lm35.py - read an LM35 on CH0 of an MCP3008 on a Raspberry Pi
# mostly nicked from
#  http://jeremyblythe.blogspot.ca/2012/09/raspberry-pi-hardware-spi-analog-inputs.html

import spidev
import time

spi = spidev.SpiDev()
spi.open(0, 0)

def readadc(adcnum):
# read SPI data from MCP3008 chip, 8 possible adc's (0 thru 7)
    if adcnum > 7 or adcnum < 0:
        return -1
    r = spi.xfer2([1, 8 + adcnum << 4, 0])
    adcout = ((r[1] & 3) << 8) + r[2]
    return adcout

while True:
    value = readadc(0)
    volts = (value * 3.3) / 1024
    temperature = volts / (10.0 / 1000)
    print ("%4d/1023 => %5.3f V => %4.1f °C" % (value, volts,
            temperature))
    time.sleep(0.5)
The slightly awkward code temperature = volts / (10.0 / 1000) is just a simpler way of acknowledging that the LM35DZ puts out 10 mV (= 10/1000, or 0.01) per °C. Well-behaved sensors generally have a linear relationship between what they indicate and what they measure.
If you run the code:
sudo ./mcp3008_lm35.py
you should get something like:
  91/1023 => 0.293 V => 29.3 °C
  93/1023 => 0.300 V => 30.0 °C
  94/1023 => 0.303 V => 30.3 °C
  95/1023 => 0.306 V => 30.6 °C
  96/1023 => 0.309 V => 30.9 °C
  97/1023 => 0.313 V => 31.3 °C
  97/1023 => 0.313 V => 31.3 °C
  98/1023 => 0.316 V => 31.6 °C
  99/1023 => 0.319 V => 31.9 °C
  99/1023 => 0.319 V => 31.9 °C
 100/1023 => 0.322 V => 32.2 °C
 100/1023 => 0.322 V => 32.2 °C
 100/1023 => 0.322 V => 32.2 °C
 101/1023 => 0.325 V => 32.5 °C
 101/1023 => 0.325 V => 32.5 °C
 102/1023 => 0.329 V => 32.9 °C
 102/1023 => 0.329 V => 32.9 °C
 103/1023 => 0.332 V => 33.2 °C
Note that the sensor had been sitting over the Raspberry Pi’s CPU for a while; I don’t keep my house at 29 °C. I made the temperature go up by holding the LM35.
So, you’ve just (fairly cheaply) given your Raspberry Pi 8 analogue input channels, so it can behave much more like a real microcontroller now. I remember from my datalogging days that analogue inputs can be pretty finicky and almost always return a value even if it’s an incorrect one. Check the chip’s datasheet to see if you’re doing it right, and if in doubt, meter it!
The video of the Quite Rubbish Clock isn’t running the same code that’s in the listing. Here it is, showing off some of the handy code that’s in bgreat’s nokiaSPI Python class:
#!/usr/bin/python
# -*- coding: utf-8 -*-
# qrmovie
import time
# need to use git://github.com/mozillazg/python-qrcode.git
import qrcode
from PIL import Image, ImageFont
import ImageOps
# uses bgreat's SPI code; see
# raspberrypi.org/phpBB3/viewtopic.php?f=32&t=9814&p=262274&hilit=nokia#p261925
import nokiaSPI
noki = nokiaSPI.NokiaSPI()Â Â Â Â Â Â Â Â Â Â Â Â Â # create display device
qr = qrcode.QRCode(version=1,          # V.1 QR Code: 21x21 px
error_correction=qrcode.constants.ERROR_CORRECT_M,
box_size=2, border=1)
bg = Image.new('1', (84, 48))Â Â Â Â Â Â Â Â Â Â # blank (black) image background
# intro
noki.cls()
noki.led(0)
time.sleep(3)
for i in range(0,769,32):
noki.led(i)
time.sleep(0.04)
# display is 14 columns by 8 rows
noki.centre_word(1, 'scruss.com')
noki.centre_word(3, 'presents')
time.sleep(3)
noki.cls()
noki.centre_word(1, 'qrclock')
noki.centre_word(2, 'the')
noki.gotorc(3,3)
noki.text("[Q]uite")
noki.gotorc(4,3)
noki.text("[R]ubbish")
noki.gotorc(5,3)
noki.text(" Clock")
time.sleep(3)
elapsed=0
start_time = time.time()
while (elapsed<12):
qr.clear()
newbg = bg.copy()Â Â Â Â Â Â Â Â Â Â Â Â Â Â Â Â Â Â # copy blank background
s = time.strftime('%Y-%m-%d %H:%M:%S')
qr.add_data(s)Â Â Â Â Â Â Â Â Â Â Â Â Â Â Â Â Â Â Â Â Â # make QR Code of YYYY-MM-DD HH:MM:SS
qr.make()
qrim = qr.make_image()Â Â Â Â Â Â Â Â Â Â Â Â Â # convert qrcode object to PIL image
qrim = qrim.convert('L')Â Â Â Â Â Â Â Â Â Â Â # make greyscale
qrim = ImageOps.invert(qrim)Â Â Â Â Â Â Â # invert colours: B->W and W->B
qrim = qrim.convert('1')Â Â Â Â Â Â Â Â Â Â Â # convert back to 1-bit
newbg.paste(qrim, (18, 0))Â Â Â Â Â Â Â Â Â # paste QR Code into blank background
noki.show_image(newbg)Â Â Â Â Â Â Â Â Â Â Â Â Â # display code on LCD
time.sleep(0.4)Â Â Â Â Â Â Â Â Â Â Â Â Â Â Â Â Â Â Â Â # pause before next display
elapsed = time.time() - start_time
noki.cls()
noki.centre_word(1, 'for')
noki.centre_word(2, 'more')
noki.centre_word(3, 'details')
time.sleep(3)
noki.cls()
noki.load_bitmap("blogpost-nokia.bmp", True)
time.sleep(7)
noki.cls()
noki.centre_word(3, 'fin')
noki.centre_word(5, 'scruss, 2013')
time.sleep(1)
for i in range(768,-1,-32):
noki.led(i)
time.sleep(0.05)
time.sleep(1)
noki.cls()
Lines 43-58 show off the QR clock for a maximum of 12 seconds. Any more, and you’d get really bored.
The screen handling functions I used are:
cls() — Clears the screen.
led(brightness) — sets the backlight to brightness. For me, full brightness is at 768. A value of zero turns the backlight off. If you don’t have the screen LED connected to one of the Raspberry Pi’s PWM pin, this will either be full on (for any brightness >= 1), or off, for brightness=0. This is used to fade up the screen in lines 24-26, and fade it down far too theatrically in lines 72-74.
show_image(PILImage) — display a single bit depth black and white Python Imaging Library object PILImage. This can be no larger than 84×48 pixels.
load_bitmap(file, Invert) — load a single bit depth black and white BMP file of maximum size 48×84. If Invert is true, keep the colours as they are, otherwise swap black and white to make a negative image. nokiSPI flips images by 90°, so the image I loaded to show the URL of the blog post looks like this:
(I know, I could have generated this in code, but I’d already made the image using qrencode. I couldn’t be bothered working out the image size and offsets.)
The text handling functions I used are:
gotorc(row, column) — move the text cursor to row, column. The screen only has 14 columns by 8 rows if you use the standard 6×6 pixel font, so keep your text short to avoid disappointment.
text(text) — write text at the current cursor position.
centre_word(row, text) — write text centred in row row. Since the text rows are a maximum of 14 columns, text with an odd number of characters will appear slightly off-centre.
There are many more functions in the nokiaSPI class; watch the demo, have a dig through the source and see what you can use.
Update: Eep! This post was featured on the Raspberry Pi blog today. Thanks, Liz!
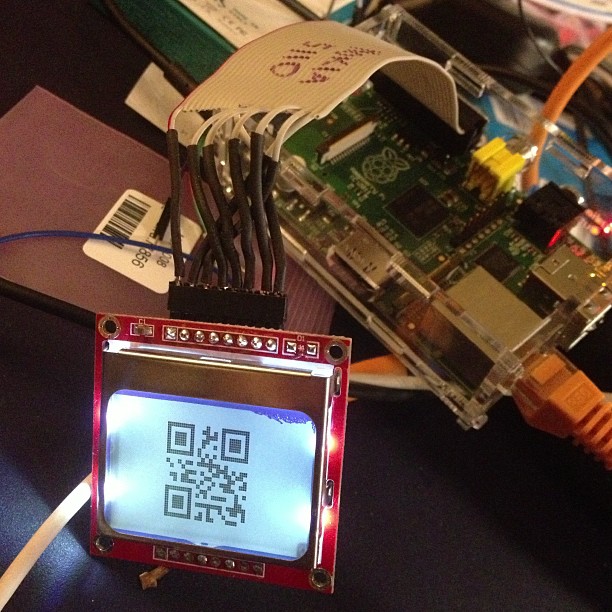
And now for something completely different:
… a clock that isn’t human readable. You’ll need a QR code reader to be able to tell the time.
This, however, is not the prime purpose of the exercise. I was looking for an excuse to try some direct hardware projects with the GPIO, and I remembered I had a couple of Nokia-style surplus LCDs lying about that could be pressed into service. These LCDs aren’t great: 84×48 pixels, 3V3 logic, driven by SPI via an 8-pin header which includes PWM-controllable LED backlighting. They are cheap, and available almost everywhere: DealExtreme ($5.36), SparkFun ($9.95), Adafruit ($10, but includes a level shifter, which you really need if you’re using a 5V logic Arduino), Solarbotics ($10) and Creatron (about $12; but you can walk right in and buy one). Despite being quite difficult to use, helpful people have written drivers to make these behave like tiny dot-addressable screens.
I’d been following the discussion on the Raspberry Pi forum about driving the Nokia LCD from a Raspberry Pi. Only when user bgreat posted some compact code that was supposed to run really fast did I dig out the LCD board and jumper wires. Building on bgreat’s nokiaSPI.py class and a few other bits of code, here’s what I built to make this singularly pointless clock:
#!/usr/bin/python
# -*- coding: utf-8 -*-
# qrclock - The Quite Rubbish Clock for Raspberry Pi - scruss, 2013-01-19
import time
# need to use git://github.com/mozillazg/python-qrcode.git
import qrcode
from PIL import Image
import ImageOps
# uses bgreat's SPI code; see
# raspberrypi.org/phpBB3/viewtopic.php?f=32&amp;amp;amp;t=9814&amp;amp;amp;p=262274&amp;amp;amp;hilit=nokia#p261925
import nokiaSPI
noki = nokiaSPI.NokiaSPI() # create display device
qr = qrcode.QRCode(version=1, # V.1 QR Code: 21x21 px
error_correction=qrcode.constants.ERROR_CORRECT_M,
box_size=2, border=1)
bg = Image.new('1', (84, 48)) # blank (black) image background
while 1:
qr.clear()
newbg = bg.copy() # copy blank background
s = time.strftime('%Y-%m-%d %H:%M:%S')
qr.add_data(s) # make QR Code of YYYY-MM-DD HH:MM:SS
qr.make()
qrim = qr.make_image() # convert qrcode object to PIL image
qrim = qrim.convert('L') # make greyscale
qrim = ImageOps.invert(qrim) # invert colours: B-&amp;amp;gt;W and W-&amp;amp;gt;B
qrim = qrim.convert('1') # convert back to 1-bit
newbg.paste(qrim, (18, 0)) # paste QR Code into blank background
noki.show_image(newbg) # display code on LCD
time.sleep(0.4) # pause before next display
(Convenient archive of all the source: qrclock2.zip, really including bgreat’s nokiaSPI class this time …)
To get all this working on your Raspberry Pi, there’s a fair amount of configuration. The best references are bgreat’s own comments in the thread, but I’ve tried to include everything here.
Enabling the SPI kernel module
As root, edit the kernel module blacklist file:
sudo vi /etc/modprobe.d/raspi-blacklist.conf
Comment out the spi-bcm2708 line so it looks like this:
#blacklist spi-bcm2708
Save the file so that the module will load on future reboots. To enable the module now, enter:
sudo modprobe spi-bcm2708
Now, if you run the lsmod command, you should see something like:
Module                  Size  Used by
spi_bcm2708             4421  0
Installing the WiringPi, SPI and other required packages
WiringPi by Gordon is one of the neater Raspberry Pi-specific modules, as it allows relatively easy access to the Raspberry Pi’s GPIO pins. For Raspbian, there are a few other imaging libraries and package management tools you’ll need to install here:
Finding a library that provided all the right functions was the hardest part here. I ended up using mozillazg‘s fork of lincolnloop‘s python-qrcode module. mozillazg’s fork lets you use most of the lovely PIL methods, while the original hides most of them. Since I had to do some image compositing and colour remapping to make the image appear correct on the Nokia screen, the new fork was very helpful.
To install it:
git clone git://github.com/mozillazg/python-qrcode.git
cd python-qrcode/
sudo python ./setup.py install
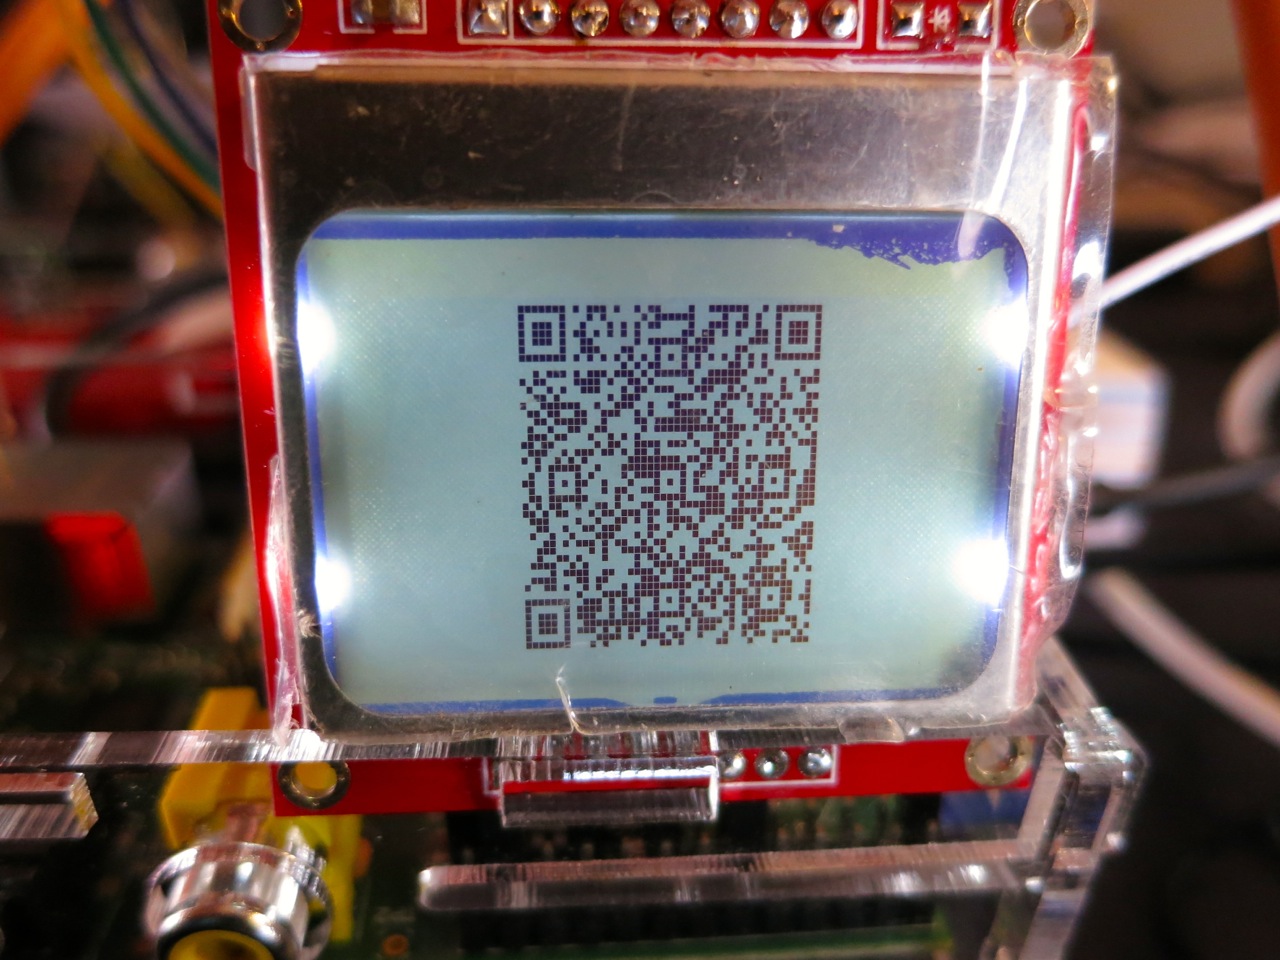
The tiny 84×48 resolution of the Nokia screen doesn’t give you many options for sizing QR codes. For the time display of the clock, a 21×21 module Version 1 code with two pixels per module and one module margin just fits into 48 pixels. Using a medium level of error correction, you can fit the 19-character message (such as “2013-01-19 18:56:59”) into this tiny screen with a very good chance of it being read by any QR code reader.
(In the video, there’s a much larger QR code that’s a link to this blog post. That’s a Version 7 code [45×45 modules] at one pixel per module and no margin. This doesn’t meet Denso Wave’s readability guidelines, but the Nokia screen has large blank margins which seem to help. It won’t read on every phone, but you’re here at this link now, so you don’t need it …)
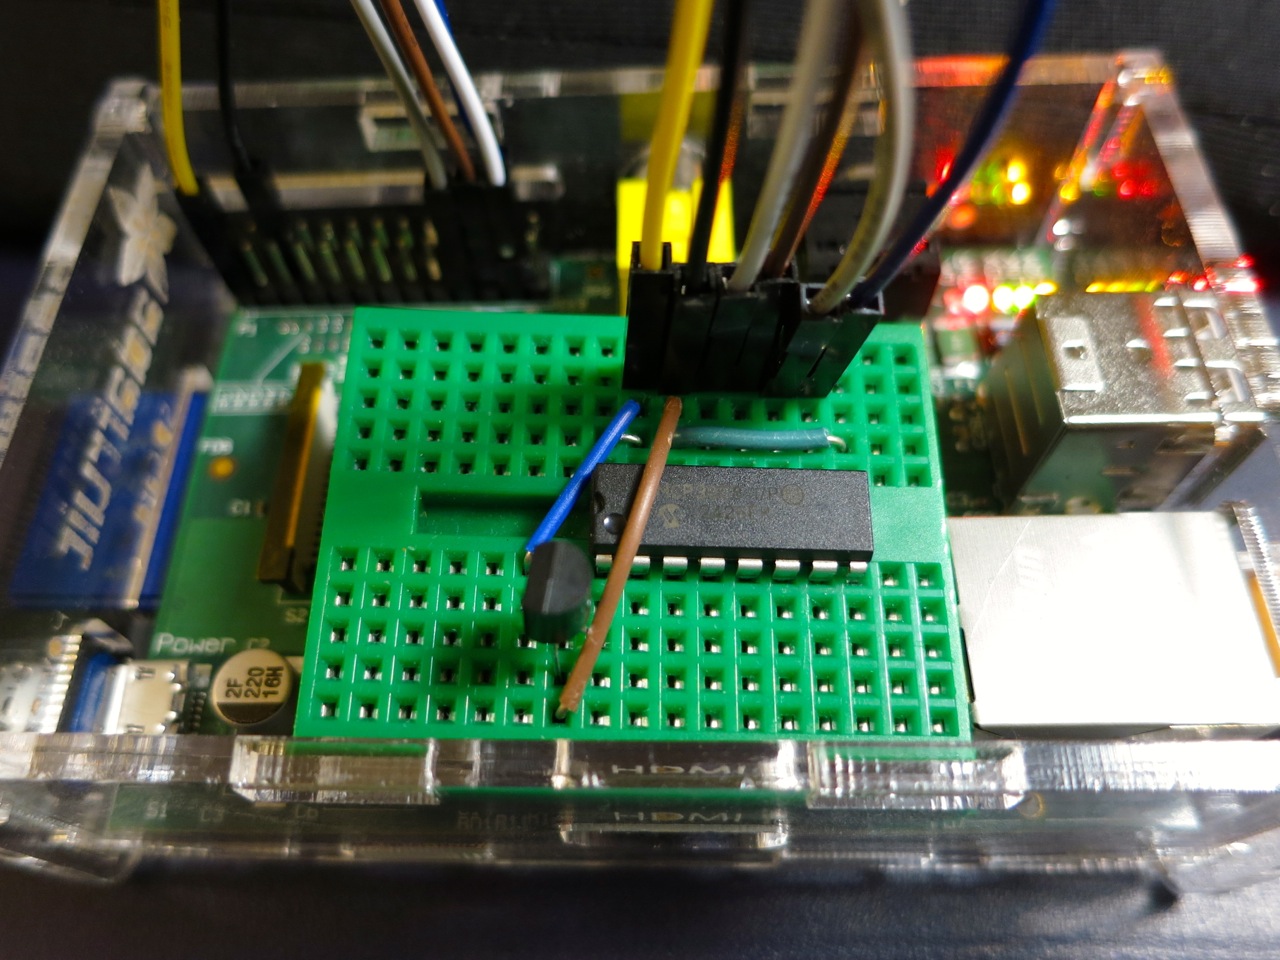
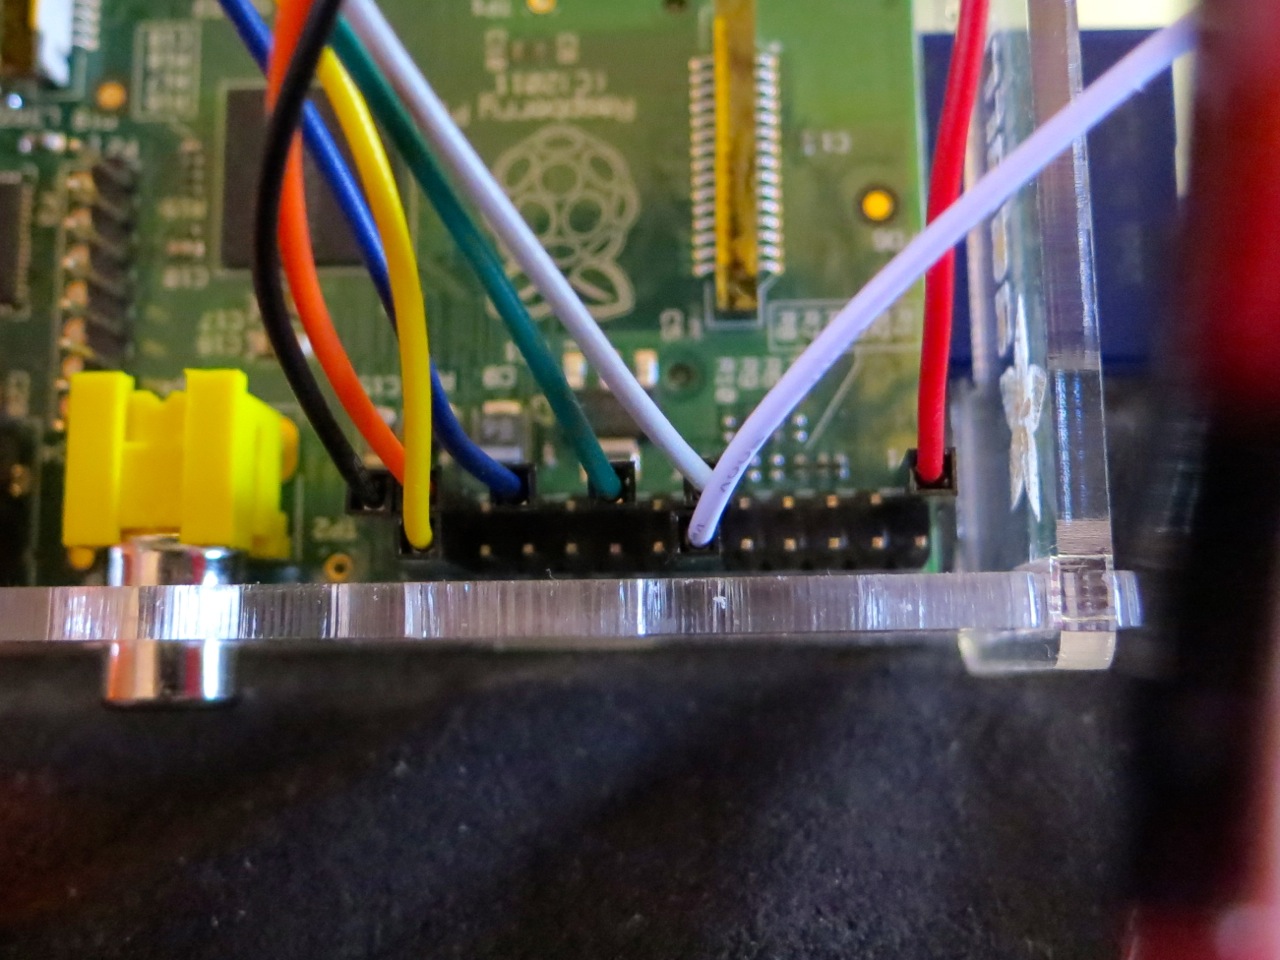
Wiring it all up
(Do I really need to say that you’ll be messing around with the inner delicate bits of your Raspberry Pi here, and if you do something wrong, you could end up with a dead Raspberry Pi? No? Okay. Just make sure you take some static precautions and you really should have the thing shut down and powered off.)
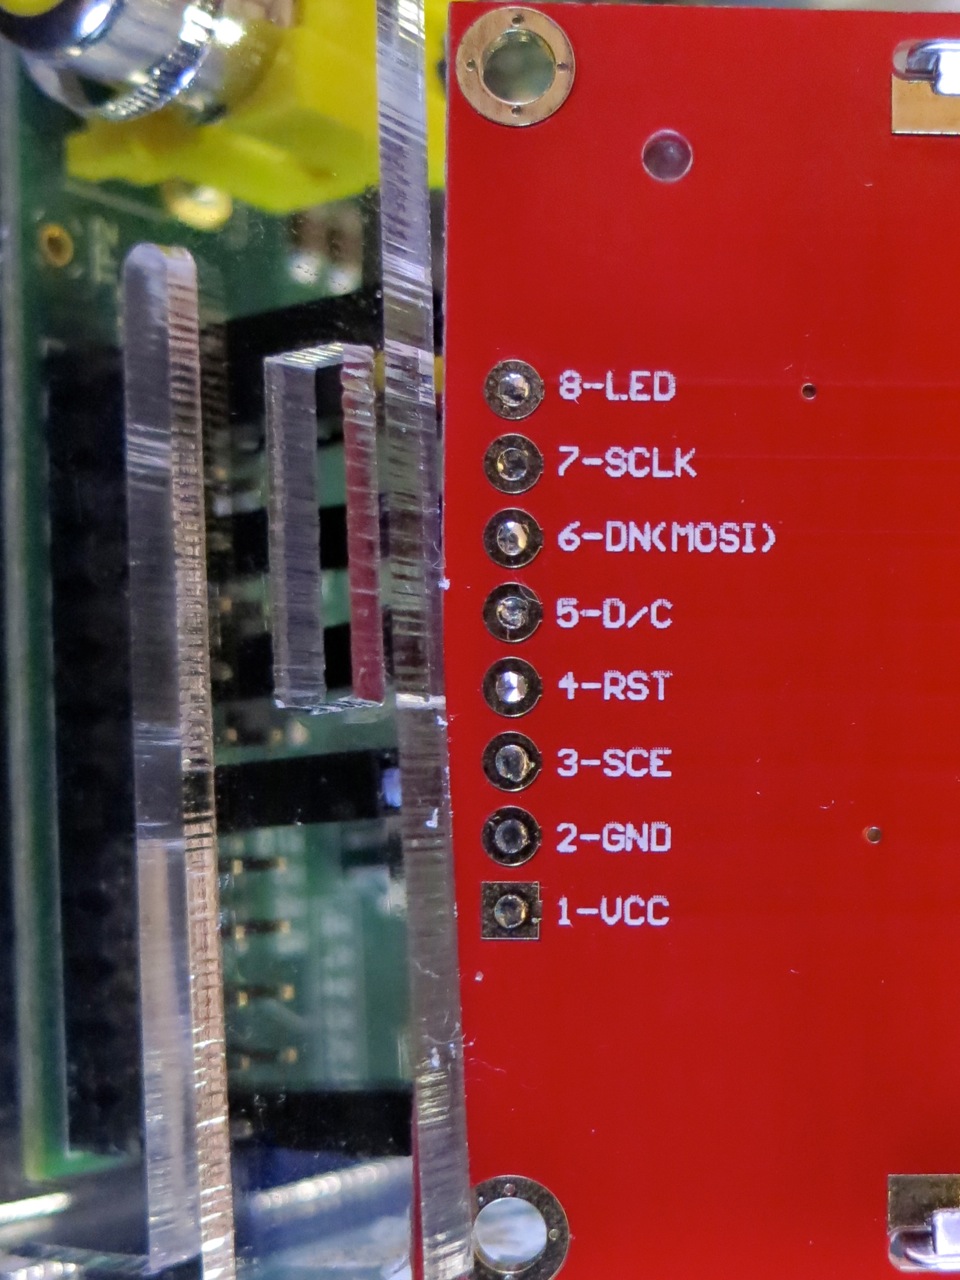
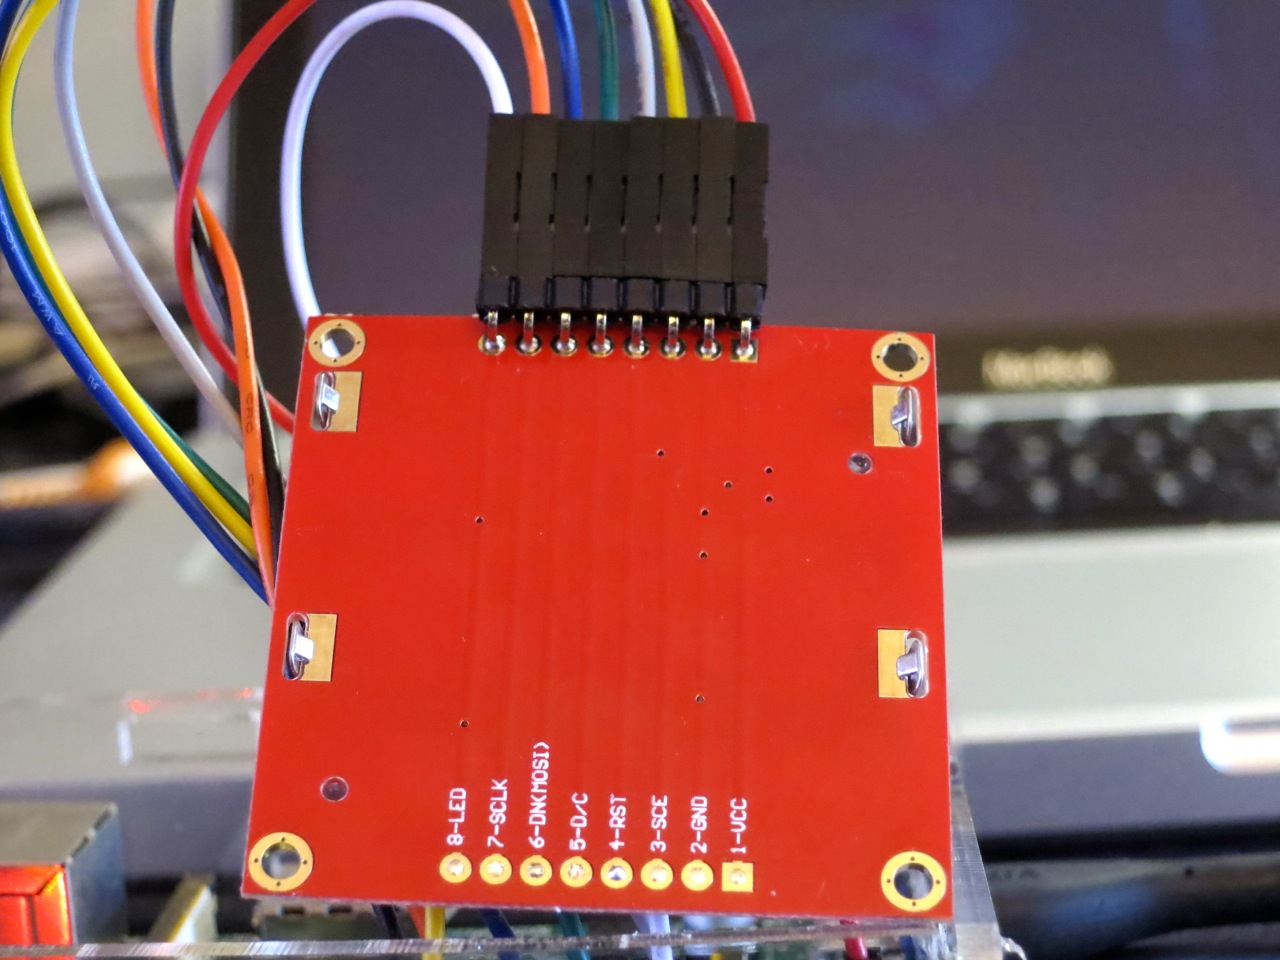
You’ll need 8 female-female right-angled ones). Note that the thick border of the LCD is the top of the screen. These boards are made who-knows-where by who-knows-whom, and there’s a hugevariety of labels and layouts on the pins. My one appears to be yet another variant, and is labelled:
VCC
GND
SCE
RST
D/C
DNK(MOSI)
SCLK
LED
This is how I wired it (from comments in bgreat’s code and the GPIO reference):
 LCD Pin       Function      Pi GPIO Pin #   Pi Pin Name
============= ============= =============== =============
 1 VCC         Vcc            1              3.3 V
 2 GND         Ground        25              GND
 3 SCE         Chip Enable   24              GPIO08 SPI0_CE0_N
 4 RST         Reset         11              GPIO17
 5 D/C         Data/Command  15              GPIO22
 6 DNK(MOSI)   Data In       19              GPIO10 SPI0_MOSI
 7 SCLK        Serial Clock  23              GPIO11 SPI0_SCLK
 8 LED         Backlight     12              GPIO18 PWM0
Wire it up, and fire up the program:
sudo ./qrclock.py
Yes, code that accesses GPIO needs to be run as root. Pesky, but helps you avoid running code that accidentally scrams the nuclear power station you’re controlling from your Raspberry Pi …


