Pen plotters were pretty expensive and complex pieces of electromechanical equipment. While they often earned their keep in the CAD office, they also had a function that’s almost forgotten: they could be used as input devices, too.
As a kid, we sometimes used to drive past the office of Ferranti-Cetec in Edinburgh. They specialized in digitizers: great big desk or wall mounted devices for capturing points from maps and drawings. Here’s one of their 1973 models:

While the technology and size have changed a bit, these huge bits of engineering kit are the ancestors of today’s track pads and touch screens.
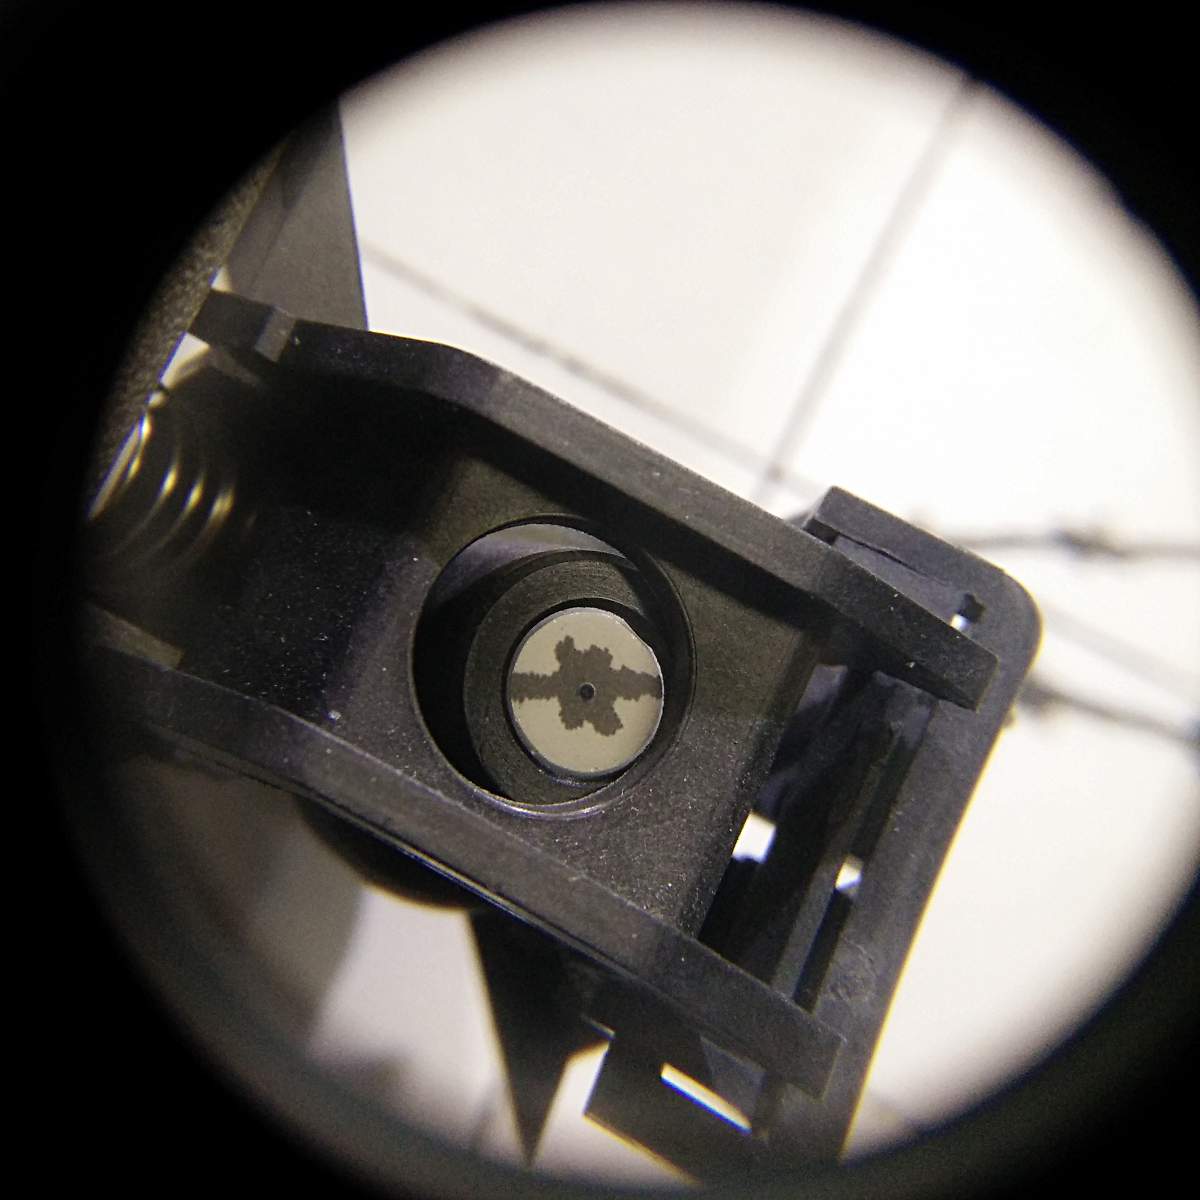
Realizing that their plotters had very precise X-Y indexing and that they had two-way communications to a computer, HP made a drafting sight that fitted in place of a pen on their plotters:

This is a very pleasing piece of kit, all metal, thick plastic and polished optical glass. They show up on eBay occasionally, and aren’t cheap. With a bit of coercion, it fits into my HP plotter like this:
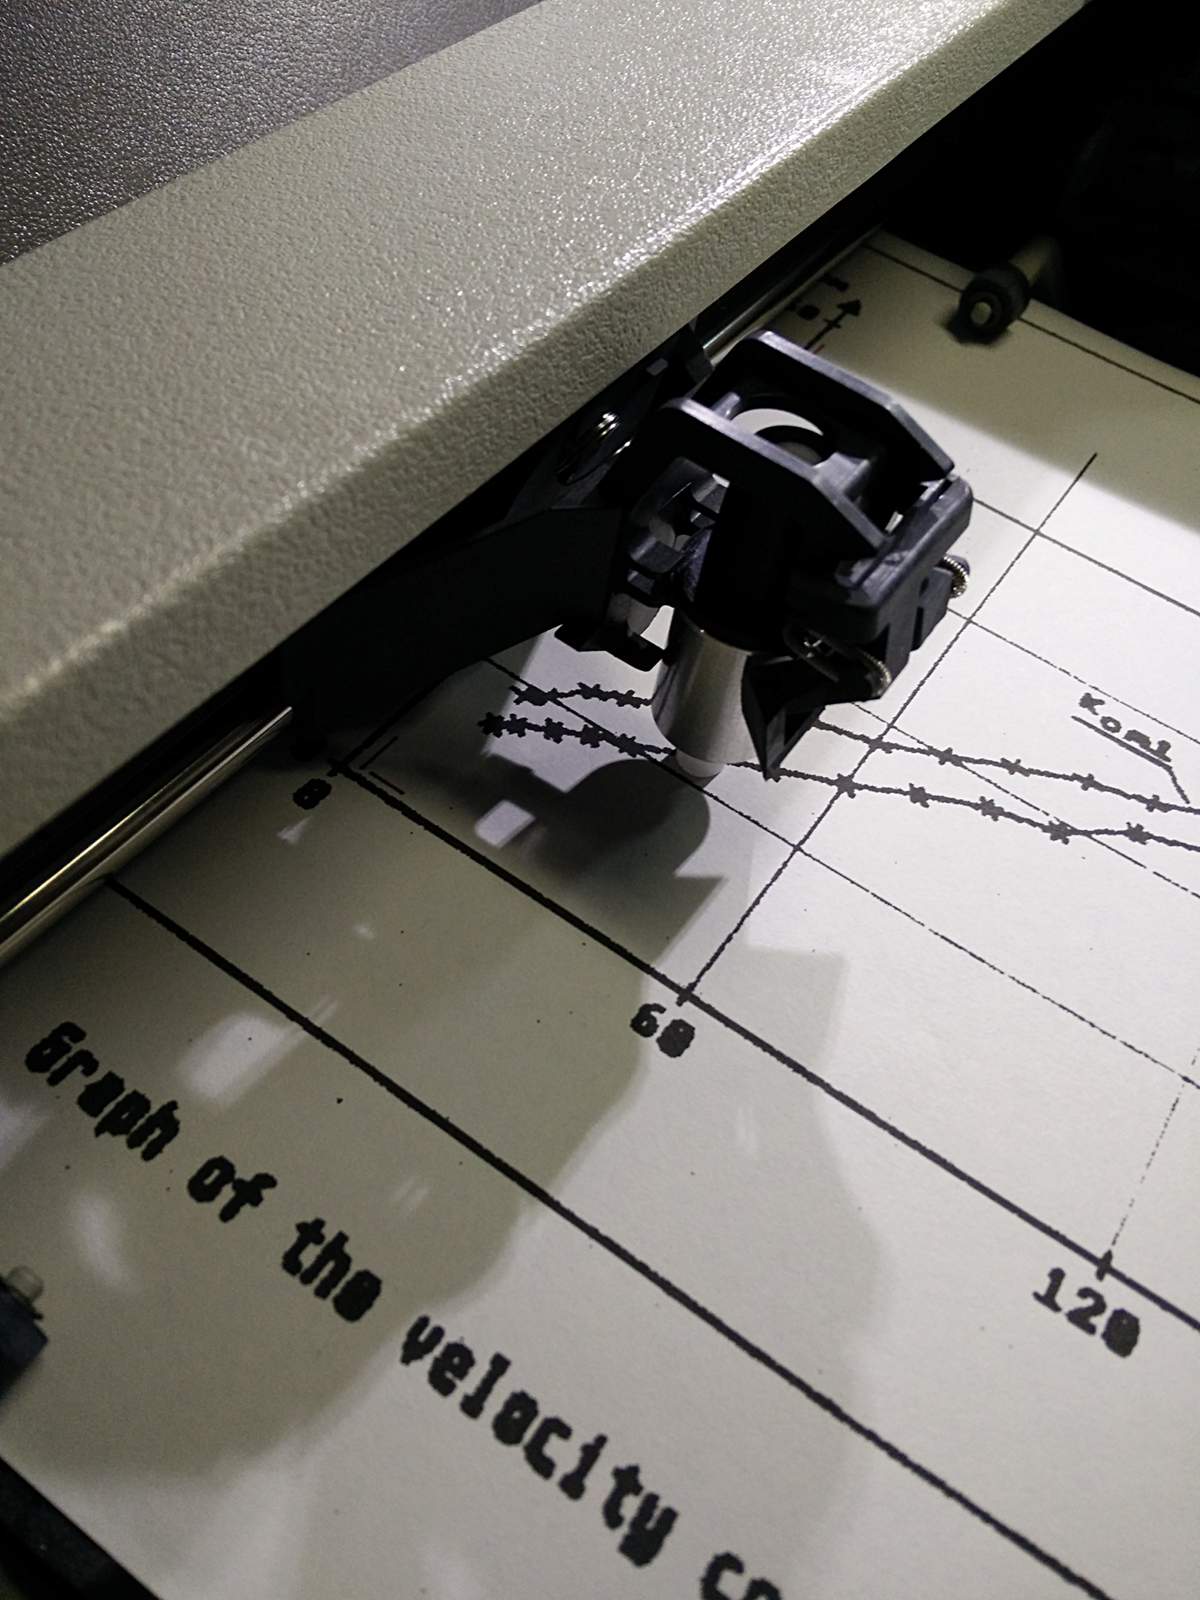
The image is very bright and clear:

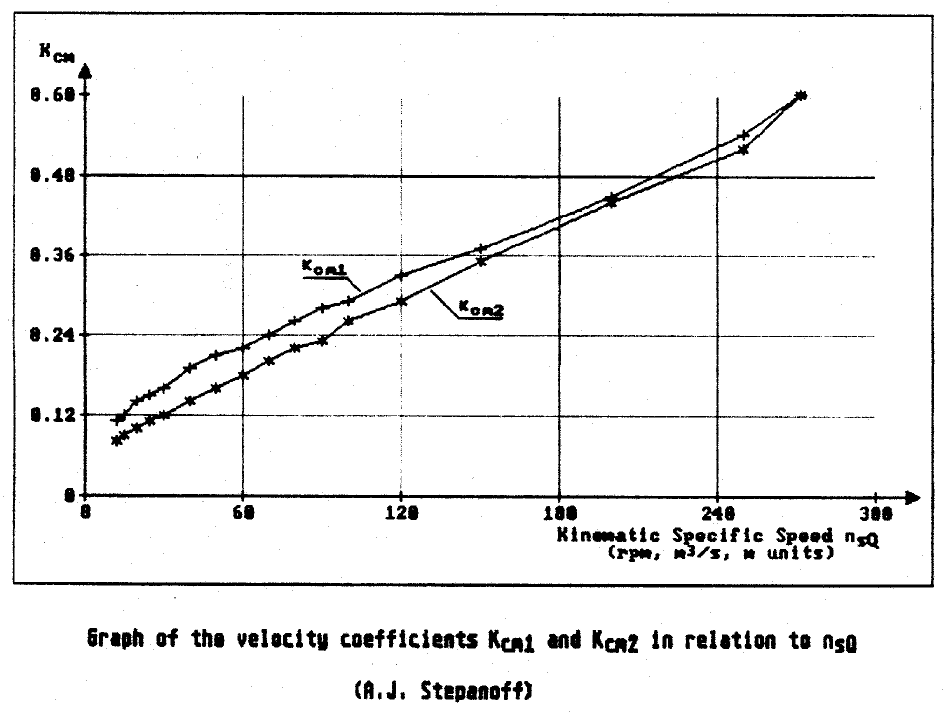
If one has a digitizing sight, one needs to find something to digitize post haste. I’m sure everyone can sense the urgency in that. So I found this, a scan from my undergraduate project writeup (centrifugal pump impeller design ftw, or something), which was probably made on an Amiga or Atari ST:
I printed this as large as I could on Letter paper, as it’s the only size my HP7470A plotter can take. Now all it needed was a small matter of programming to get the data from the plotter. Here’s a minimally-useful digitizer for HP and compatible serial plotters. Although I ran it on my little HP grit wheel plotter attached to a Raspberry Pi, I developed it with my larger Roland plotter. The only fancy module it needs is pySerial.
#!/usr/bin/env python
# -*- coding: utf-8 -*-
# a really crap HP-GL point digitizer
#  scruss - 2016

from time import sleep
from string import strip
import serial

ser = serial.Serial(port='/dev/ttyUSB1', baudrate=9600, timeout=0.5)
lbl = ''
points = []
labels = []
k = 0
retval = 0

ser.write('DP;')                # put in digitizing mode
while lbl != 'quit':
    ser.write('OS;')
    ret = strip(ser.read(size=5), chr(13))
    print ('Retval: ', ret)
    if ret != '':
        retval = int(ret)
    if retval & 4:              # bit 2 is set; we have a point!
        print ('Have Point! Retval: ', retval)
        retval = 0
        ser.write('OD;')
        pt = strip(ser.read(size=20), chr(13))
        print ('OD point: ', pt)
        lbl = raw_input('Input label [quit to end]: ')
        points.append(pt)
        labels.append(lbl)
        k = k + 1
        ser.write('DP;')        # put in digitizing mode again
    sleep(1)
ser.close()

f = open('digit.dat', 'w')
for i in range(k):
    f.write(points[i])
    f.write(',')
    f.write(labels[i])
    f.write('\n')
f.close()
In the unlikely event that anyone actually uses this, they’ll need to change the serial port details near the top of the program.
The program works like this:
- Move the drafting sight to the point you want to capture using the plotter’s cursor keys, and hit the plotter’s ENTER key
- Your computer will prompt you for a label. This can be anything except quit, that ends the program
- When you have digitized all the points you want and entered quit as the last label, the program writes the points to the file digit.dat
I didn’t implement any flow control or other buffer management, so it can crash in a variety of hilarious ways. I did manage to get it to work on the lower trace of that graph, and got these data:
9649,2428,1,300,0
357,2428,1,0,0
357,7217,1,0,0.60
733,3112,1,first
826,3167,1,
968,3256,1,
1122,3334,1,
1290,3405,1,
1588,3583,1,
1891,3725,1,
2215,3880,1,
2526,4051,1,
2830,4194,1,
3143,4280,1,
3455,4516,1,
4077,4767,1,
5008,5229,1,
6543,5954,1,
8067,6548,1,
8740,7195,1,
8740,7195,1,last
8740,7195,1,quit
The first two columns are X and Y, in HP-GL units — that’s 1/40 mm, or 1/1016 inches. The third column will always be 1 if you have the sight down. The last columns are the label; if you put commas in them, opening the file as CSV will split the label into columns. I used it to fudge axis points. You’ll also note that the last three lines of data are my valiant attempts to quit the program.
Assuming the axes are not skewed (they are, very slightly, but shhh) some simple linear interpolation gives you the results below:
 12.1    0.086
 15.1    0.093
 19.7    0.104
 24.7    0.114
 30.1    0.122
 39.7    0.145
 49.5    0.162
 60.0    0.182
 70.0    0.203
 79.8    0.221
 89.9    0.232
100.0    0.262
120.1    0.293
150.2    0.351
199.7    0.442
248.9    0.516
270.7    0.597
Good enough for a demo.
(For prettier things to do with plotter digitizing commands, Ed Nisley KE4ZNU has made some rather lovely Superformula patterns)
If you don’t have a plotter, or even if you do and you don’t have hours to waste mucking about with Python, obsolete optics and serial connections, Ankit Rohatgi’s excellent WebPlotDigitizer (or Engauge, as I found out when this article hit HackerNews in 2021) gets numbers out of graphs quickly. It handles all sorts of graphs rather well.
Update, 2025: eek, but WebPlotDigitizer is now login-only and has been infested by AI shite. Run away now, run away fast … or try to find an old mirror online, such as WebPlotDigitizer at utk.edu.
Leave a Reply