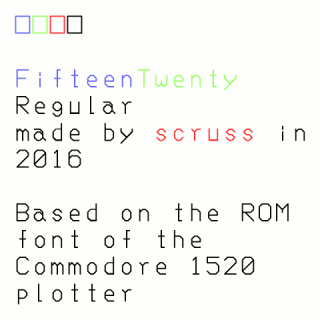
FifteenTwenty: Commodore 1520 plotter font

FifteenTwentyFor the impatient: download FifteenTwenty-master.zip FifteenTwenty-Regular-OTF.zip (or more options …)
Updated: now with all ASCII glyphs!

Update, September 2016: this font was officially squee‘d over by Josh “cortex” Millard on the Metafilter Podcast #120: Hard Out There For A Nerd. I had the great pleasure of meeting Josh at XOXO 2016, too.

The Commodore 1520 was a tiny pen plotter sold for the Commodore 64 home computer. It looked like this:

Commodore 1520 printer plotter (adjusted).jpg
Commodore 1520 printer plotter — by Oguenther (Dr.Guenther). – This file was derived from Cbm1520-2.jpg: , Public Domain, https://commons.wikimedia.org/w/index.php?curid=39145769

I never owned one, but it seems it was more of a curiosity than a useful product.

From a nerdy point of view, however, this device was rather clever in that it packed a whole plotter command language, including a usable font, into 2048 bytes of ROM. Nothing is that small any more.

Thanks to the epic efforts of Jim Brain and others, this ROM is now archived on Project 64 Reloaded. Looking at the code, I was struck by the elegance of the encoding: it packs a full X-Y plot instruction in one byte.

Based on my work with the Hershey font collection, I thought it would be fun to extract the coordinates and make a real OpenType font from these data. I’m sure others would sense the urgency in this task, too.

Since Commodore computers used a subset of ASCII, there’s a barely-usable set of characters in this first release. Notable missing characters include:

U+005C    \    REVERSE SOLIDUS
U+005E    ^    CIRCUMFLEX ACCENT
U+0060    `    GRAVE ACCENT
U+007B    {    LEFT CURLY BRACKET
U+007C    |    VERTICAL LINE
U+007D    }    RIGHT CURLY BRACKET
U+007E    ~    TILDE

I’ll get to those later, perhaps.

Huge thanks to all who helped get the data, and make the bits of software I used to make this outline font.

(Note: although the Project 64 Reloaded contains some extraction code to nominally produce an SVG font, it doesn’t work properly — and SVG fonts are pretty much dead anyway. I didn’t base any of my work on their Ruby code.)

Did it just get a little more nerdy in here?

VA3PID-eQSL-eWAS-PSK-20131014Aw yiss! After more than two years of trying, I finally got a confirmed contact in North Dakota last night. That means I’ve now worked all of the US states using the PSK digital mode. Yay me!

I’d contacted 47/50 within a few months of getting my licence, including Maine. Utah I spoke to in November 2011, South Dakota in January 2012; but the last one, North Dakota, I didn’t pick up until last night. I was just about to turn off the radio for the night when I have 40m a try, and there was Bill (ND0B) calling from Cathay, ND. Sometimes you find what you’re looking for without even trying. Happy Thanksgiving!

on the trail of the elusive Power Cost Monitor signal

Catherine probably thought I was acting no more strangely than usual last night, when I was holding the Power Cost display unit in one hand, frobbing the electric stove control with the other, all the while watching a digital clock and cackling gently to myself.

All this makes me think I’m a bit further on with getting something from the Power Cost Monitor. Previous attempts using cheap wireless units (and cluelessness on my part — never forget that) got nothing, so I caved and bought the rather expensive but nice Parallax 433 MHz RF Transceiver from Solarbotics.

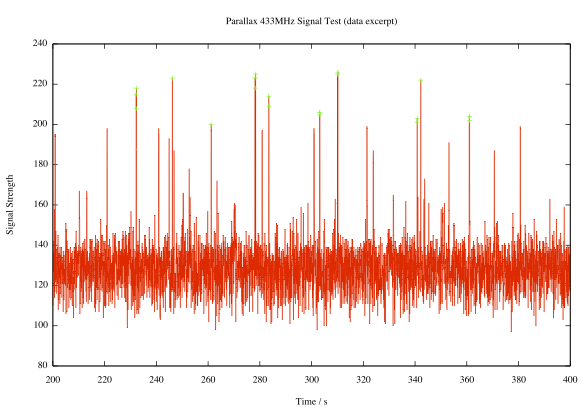
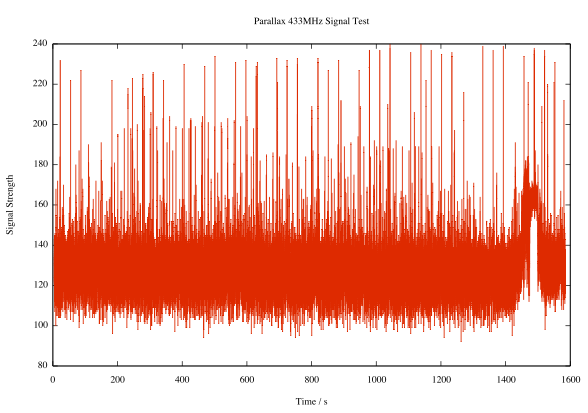
The Parallax unit adds an analogue output that’s proportional to the instantaneous signal strength. I hooked up the output to the trusty sdfatlib analogue logger, set the logger to sample every 50ms (figuring that, every now and again, it’s going to see part of a transmission) and this is what I saw:

Pretty noisy, I know. But look, there are regular peaks:

Here I’ve highlighted all the peaks with signal strength ≥ 200 (in arbitrary units, where 1024 would be full scale). It’s pretty regular; the largest peaks come in a shade under every 32 seconds, or a multiple thereof. If you need additional decimal places to validate your worldview, I’m thinking the period’s around 31.86s.

Observations made during last night’s frobbing and cackling episode seem to confirm that the display updates about every 32s. If you adjust the load mid-cycle, nothing changes until the update. If the display misses an update, it’ll refresh in 64 or 96 seconds.

I don’t yet know what bitrate the data comes through at, or the protocol. I’ve logged some data recorded at various rates: 433mhz_powercost_data. The file names give a hint at the data rate; L1200V04 was recorded at 1200bps, for example. I’m guessing that there’s some kind of sync header, then the total value and the current temperature (which was around/below freezing at the time). I need to work on that.

Update: I rewrote the logger to use the Arduino’s internal UART, since — lovely though NewSoftSerial may be — it causes millis() to report wildly inaccurate times at low bit rates. I recorded a bunch more data (powercost-arduino2.zip) in a slightly more useful text format. It has three columns:

  • the time, in milliseconds, at which the record was recorded
  • the time difference between this and the previous record, in milliseconds. Maybe not as useful as it could be. If adjacent records are about 31860ms apart, they’re transmissions from the meter.
  • 120 bytes of data recorded at the current bit rate (given in the file name) encoded in hex.

I’ve also included the Arduino sketch, which could be better documented.

big trouble in little microSD

It was a bit of a fight to get the SparkFun microSD Shield working. At first, I thought it was my choice of cards. Then, on reading the manual (ahem), I discovered the section “I downloaded a FAT library for Arduino on my own from the Web but it’s not working! Why not?“. It seems that the SparkFun shield uses non-standard pins for signalling, which they consider a feature, but some consider a bug.

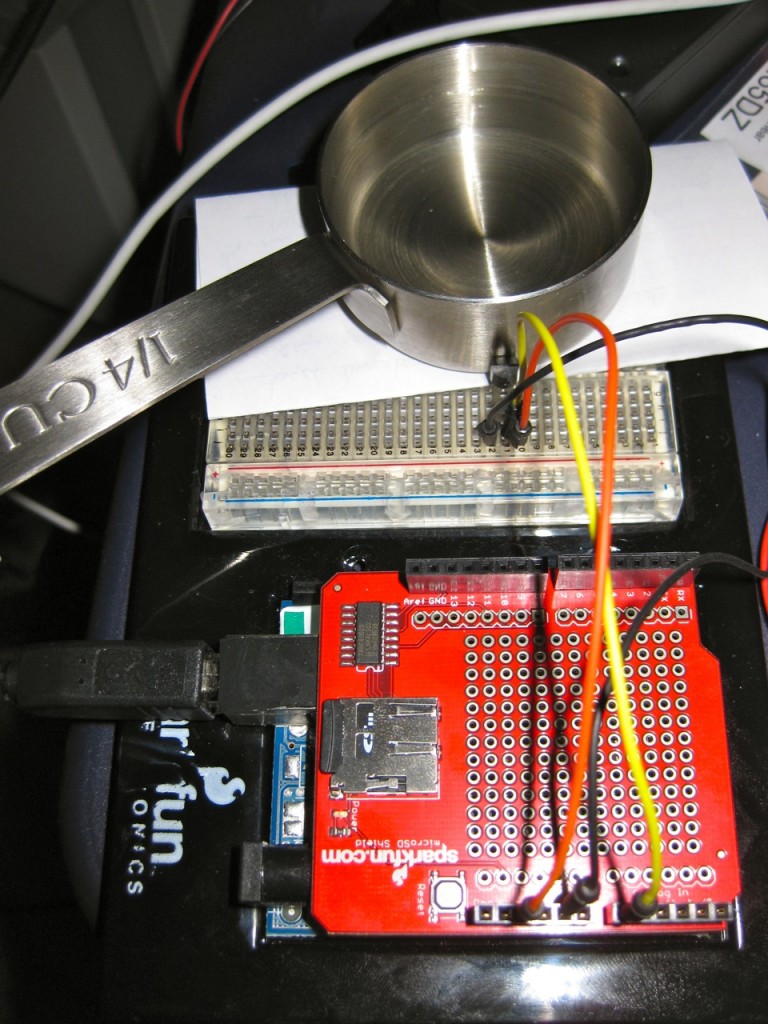
After fixing the code in the awesome sdfatlib library, I’ve now got it logging the temperature of a cooling container of hot water:

You might just be able to make out the LM35 pressed up against the measuring cup.
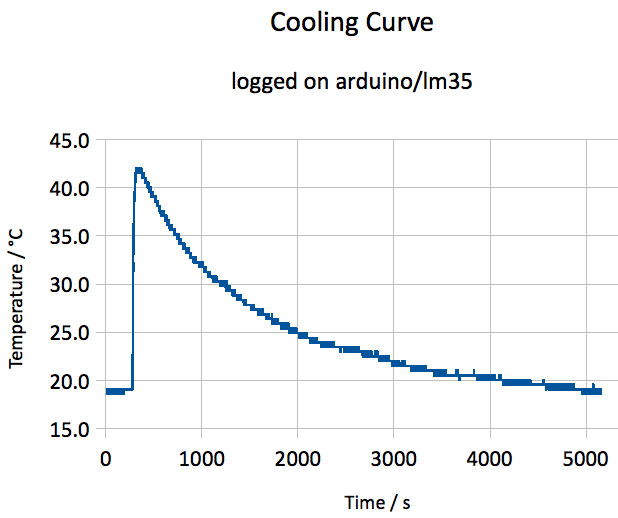
I remember making a right mess of this experiment in my school final Physics practical exam. I also used to do this in my first job when bored testing Campbell CR10 dataloggers, making a nice 1-d cooling curve with a thermocouple and a cup of hot water.

I think the heating came on a couple of times, as there shouldn’t be bumps in the curve. Here’s the data.

to work, and back again

Biked to work today, and just got back. Maybe not the smartest choice of a day â€” second hottest of the year, with thunderstorms threatened — but I made it. Going there was rather slow, as I got lost a couple of times, but coming back was faster than transit.

If I felt really nerdy, I’d post my route as GPX, but it’s a bit twisty.