Blueline / Black & Decker Power Monitor RF Packets

Update 2014-10-02: I’ve forked Bryan’s Arduino code and added some instructions: scruss/Powermon433 (though use Bryan’s, srsly)

Update 2014-08-19: Bryan Mayland has decoded the data on Arduino! More details here: CapnBry/Powermon433

Given that I first started thinking about reverse-engineering the Blueline Powercost Monitor‘s data stream in September 2010, I hardly win any awards for rapid development. Here’s what I know so far about the device and its transmissions:

  • The Blueline unit and the (now discontinued) Black & Decker Power Monitor (EM100B) appear to be functionally identical. Both transmit data using simple ASK/OOK at 433.92 MHz in the ISM band.
  • It is, however, completely different from the Norgo NGE101 meter, dammit.
  • The display unit is made by Hideki Electronic Limited, who make many small weather stations and wireless displays. [Pictures of the display circuit boards]
    Inside a Black & Decker Power Meter
  • The transmitter unit was designed by Intectus in Ottawa for Blueline. It uses a TI MSP430 µcontroller. [Transmitter board picture]
    Black & Decker Power Monitor: Meter Transmitter board
  • The transmitter can be triggered by simulating a power meter if you flash a 940 nm IR Emitter LED for 50 ms into its sensor. 1× 50 ms flash represents 1 Wh of power consumed. A pulse frequency of 1 Hz represents 3.6 kW consumption.
    Arduino-based domestic power meter simulator
  • The transmitter sends a bundle of three (seemingly) identical packets every 31.8 seconds. These appear to contain consumption data, as the display updates approximately every 32 seconds.
    a data packet bundle
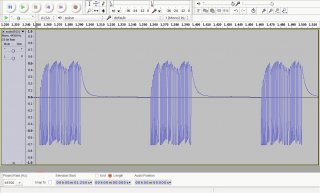
  • A series of contiguous packets, recorded as audio using a simple circuit described by the Protocol Analyzer project: audio201311182215-silenced (FLAC; please note that interstitial silences have been blanked to reduce file size).
  • Temperature packets may be sent separately from power, as the display updates temperature much more slowly than power use.
  • Power packets only appear to contain use data (along with a transmitter ID). If the sensor receives an absolutely constant input, the packets transmitted 32 s apart can be identical.
    powermeter-203453vs203525
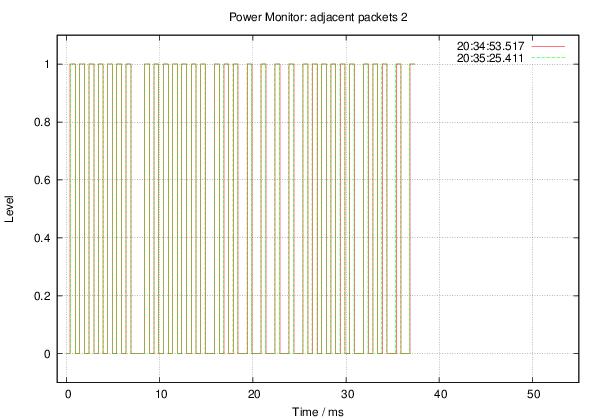
  • The packets appear to be Manchester-encoded.

Some rough notes on mark/space timing (all times in µs):

Mark : Mean    529.4 Min    499.0 Max    590.0 StdDev:   15.03 
Space: Mean    694.5 Min    385.0 Max   1474.0 StdDev:  281.57

Mark/space times, by frequency (all times in µs):

MARK
====

          µS
Rank     Value   Count
-------- ------- -----
     1         522  498
     2         544  206
     3         567   32
     4         499   32
     5         590    8

SPACE
=====

          µS
Rank     Value   Count
-------- ------- -----
     1         476  279
     2         975  223
     3         454   99
     4         952   65
     5         431   26
     6        1474   22
     7         408   21
     8         499   17
     9         998   12
    10      199000    8
    11         385    2
    12        1451    2

More later, including raw packet data.

Thanks to Randy Simons and Bryan Mayland for the recent help. Thanks too to Brett “Wiring” Hagman for asking just why I was trying to do this …

Power Cost Monitor signals — for reals!

After doing almost nothing with the Arduino and the elusive Power Cost Monitor signal, I’m finally getting something from it. Matt Colyer’s Power Monitor sketch does all the heavy lifting, for he managed to reverse engineer the protocol. His solution is a rather complex one, involving ethernet shields and Ruby. All I wanted was a simple serial logger, so I cut down Matt’s code, and modified the network output to simple print statements:

== Waiting (38464857ms, 1676 bytes) ==
== Sending (38467858ms, 1668 bytes) ==
sample[data]=0000000a
sample[data]=0000015a
== Waiting (38467863ms, 1676 bytes) ==
== Received (38592156ms, 1670 bytes) ==
== Waiting (38592157ms, 1676 bytes) ==
== Sending (38595158ms, 1668 bytes) ==
sample[data]=00000000
== Waiting (38595159ms, 1676 bytes) ==
== Received (38624334ms, 1670 bytes) ==
== Waiting (38624335ms, 1676 bytes) ==
== Sending (38627336ms, 1668 bytes) ==
sample[data]=ffffe746
== Waiting (38627337ms, 1676 bytes) ==
== Received (38688007ms, 1670 bytes) ==
== Waiting (38688009ms, 1676 bytes) ==
== Received (38688045ms, 1670 bytes) ==
== Waiting (38688046ms, 1676 bytes) ==
== Sending (38691047ms, 1668 bytes) ==
sample[data]=00001748
sample[data]=00000008
== Waiting (38691052ms, 1676 bytes) ==
== Received (38720026ms, 1670 bytes) ==
== Waiting (38720027ms, 1676 bytes) ==
== Sending (38723028ms, 1668 bytes) ==
sample[data]=00000000
== Waiting (38723030ms, 1676 bytes) ==
== Received (38783686ms, 1670 bytes) ==
== Waiting (38783687ms, 1676 bytes) ==
== Sending (38786688ms, 1668 bytes) ==
sample[data]=00000011
== Waiting (38786689ms, 1676 bytes) ==
== Received (38815636ms, 1670 bytes) ==
== Waiting (38815637ms, 1676 bytes) ==
== Sending (38818638ms, 1668 bytes) ==
sample[data]=fffff322
== Waiting (38818639ms, 1676 bytes) ==
== Received (38847547ms, 1670 bytes) ==
== Waiting (38847548ms, 1676 bytes) ==
== Sending (38850549ms, 1668 bytes) ==
sample[data]=00000001
== Waiting (38850550ms, 1676 bytes) ==
== Received (38879444ms, 1670 bytes) ==
== Waiting (38879446ms, 1676 bytes) ==
== Sending (38882445ms, 1668 bytes) ==
sample[data]=0000374f
== Waiting (38882446ms, 1676 bytes) ==
== Received (38911210ms, 1670 bytes) ==
== Waiting (38911211ms, 1676 bytes) ==
== Sending (38914212ms, 1668 bytes) ==
sample[data]=00000043
== Waiting (38914213ms, 1676 bytes) ==
== Received (39006981ms, 1670 bytes) ==
== Waiting (39006982ms, 1676 bytes) ==
== Sending (39009982ms, 1668 bytes) ==
sample[data]=00000000
== Waiting (39009983ms, 1676 bytes) ==
== Received (39038895ms, 1670 bytes) ==
== Waiting (39038896ms, 1676 bytes) ==
== Sending (39041897ms, 1668 bytes) ==
sample[data]=00000001
== Waiting (39041898ms, 1676 bytes) ==
== Received (39102999ms, 1670 bytes) ==
== Waiting (39103000ms, 1676 bytes) ==
== Sending (39106001ms, 1668 bytes) ==
sample[data]=00000000
== Waiting (39106002ms, 1676 bytes) ==
== Received (39134880ms, 1670 bytes) ==
== Waiting (39134881ms, 1676 bytes) ==
== Sending (39137882ms, 1668 bytes) ==
sample[data]=00000001
== Waiting (39137883ms, 1676 bytes) ==

Now it’s just a small matter of programming to work out what Matt’s Ruby code does. Ruby always looks to me like two programmers started coding at different ends of the same line, and collided in the middle. I’m hoping there’s enough processing power in the Arduino to do the conversion in the chip, and output useful log data as a serial stream.

More later …


on the trail of the elusive Power Cost Monitor signal

Catherine probably thought I was acting no more strangely than usual last night, when I was holding the Power Cost display unit in one hand, frobbing the electric stove control with the other, all the while watching a digital clock and cackling gently to myself.

All this makes me think I’m a bit further on with getting something from the Power Cost Monitor. Previous attempts using cheap wireless units (and cluelessness on my part — never forget that) got nothing, so I caved and bought the rather expensive but nice Parallax 433 MHz RF Transceiver from Solarbotics.

The Parallax unit adds an analogue output that’s proportional to the instantaneous signal strength. I hooked up the output to the trusty sdfatlib analogue logger, set the logger to sample every 50ms (figuring that, every now and again, it’s going to see part of a transmission) and this is what I saw:

Pretty noisy, I know. But look, there are regular peaks:

Here I’ve highlighted all the peaks with signal strength ≥ 200 (in arbitrary units, where 1024 would be full scale). It’s pretty regular; the largest peaks come in a shade under every 32 seconds, or a multiple thereof. If you need additional decimal places to validate your worldview, I’m thinking the period’s around 31.86s.

Observations made during last night’s frobbing and cackling episode seem to confirm that the display updates about every 32s. If you adjust the load mid-cycle, nothing changes until the update. If the display misses an update, it’ll refresh in 64 or 96 seconds.

I don’t yet know what bitrate the data comes through at, or the protocol. I’ve logged some data recorded at various rates: 433mhz_powercost_data. The file names give a hint at the data rate; L1200V04 was recorded at 1200bps, for example. I’m guessing that there’s some kind of sync header, then the total value and the current temperature (which was around/below freezing at the time). I need to work on that.

Update: I rewrote the logger to use the Arduino’s internal UART, since — lovely though NewSoftSerial may be — it causes millis() to report wildly inaccurate times at low bit rates. I recorded a bunch more data (powercost-arduino2.zip) in a slightly more useful text format. It has three columns:

  • the time, in milliseconds, at which the record was recorded
  • the time difference between this and the previous record, in milliseconds. Maybe not as useful as it could be. If adjacent records are about 31860ms apart, they’re transmissions from the meter.
  • 120 bytes of data recorded at the current bit rate (given in the file name) encoded in hex.

I’ve also included the Arduino sketch, which could be better documented.

if you can measure it …

I’ve had the PowerCost Monitorâ„¢ up and running for over a week now. It was pretty easy to fit. The fiddliest bit was working out and entering the time-of-use rates – which I’ll have to change again in November.

Over the last six days that I’ve been logging it, it exactly matches our meter. That’s one of the reasons I bought it; I didn’t want to be fiddling with CT clamps which introduce their own inaccuracies. Now for the small matter of decoding its transmissions …

smarter meter

I just signed up for Toronto Hydro‘s Time-of-Use (TOU) Metering programme. While it was mentioned in this month’s PowerWISE (hey, am I the only one who reads the info inserts that comes with their bill?), it doesn’t seem to have been officially launched.  On first look, it’s fairly nifty (click the image for a full-sized view):
daily TOU breakdown hourly
Since I’m a Bullfrog customer, I don’t think I get charged TOU rates (hey, it’d be nice; actually, if coupled to current capacity, I’d make hay while the sun shines/wind blows/water flows …) but at least I get to see the data. I wonder if the front end is scriptable? I’d love to be able to track my usage day by day.

(And to think, yesterday I was on the cusp of buying a Black & Decker Power Monitor. If it had ethernet/wireless/bluetooth, I’d have been on it like an X on a Thing That X Likes. It looks a bit complex to install.)

not-so-smart meter

We got our smart meter installed today. Unfortunately, Catherine didn’t quite understand why there was a knock on the door, then her computer went beeeeyyooooww … then all our clocks caught the <blink> tag.

While I like smart meters, this one isn’t quite as smart as it could be. To me, a smart meter needs to have a big display of your current demand, and needs to be inscribed with a suitable message like “Quit using so much juice, you cretin!” It also needs to hook into local time-of-use pricing, which me being  green and a Bullfrog customer and all, I don’t get to take part in. Boo.

But what could have really gone sideways was my own desktop, which was quietly chugging away installing Ubuntu 7.10. Since I started using Linux in 1995, I don’t think I’ve ever had a system upgrade go totally smoothly. This time, though, I was lucky – the system must have fully initialised before we lost power.

I can’t honestly say I see any difference between Feisty Fawn and Gutsy Gibbon; they both are fairly pretty, and just work.