this is why I did wind power instead

07:32 - This is a Province of
Ontario emergency bulletin
which applies to people
within ten (10) kilometres
of the Pickering Nuclear
Generating Station. An
incident was reported
at the Pickering Nuclear
Generating Station. There
has been NO abnormal

Update, a few panicked minutes later: false alarm. Still no news release from OPG or province-wide phone alert to stand down, but there is this:

Just as a reminder, you can get potassium iodide pills for free if you live within 50 km of an Ontario nuclear installation. Go to preparetobesafe.ca

50 km buffer from GTA nuclear stations
50 km buffer from Pickering and Darlington nuclear stations. Includes all of Toronto and much of the GTA
50 km buffer from Bruce station

I don’t know if I should be including Chalk River in this.

Further update: yup, they retracted it. But a scary wee-waa-wee-waa siren while the text is read in a robot voice is not very reassuring

EMERGENCY ALERT /
ALERTE D’URGENCE

There is NO active nuclear
situation taking place

at the Pickering Nuclear
Generating Station. The

previous alert was issued in
error. There is no danger to
the public or environment.
No further action is
required.
Issued 09:11

q absolves data sins and makes CSV queries easy

The cryptically-named q (it also bills itself as being able to “Run SQL directly on CSV files | Text as Data”) is very nifty indeed. It allows you to run SQL queries on delimited text files. It seems to support the full SQLite SQL dialect, too.

I used to frequently query the IESO‘s Hourly Wind Generator Output report (which now hides behind a JS link to obscure the source URL, http://www.ieso.ca//imoweb/pubs/marketReports/download/HourlyWindFarmGen_20160122.csv).  Now that the file has nearly 10 years of hourly data and many (but not all) wind projects, it may have outlived its usefulness. But it does allow me to show off some mad SQLite skills …

The first problem is that the file uses nasty date formats. Today would be 23-Jan-16 in the report’s Date field, which is filled with the ugh. You can fix that, though, with a fragment of SQL modified from here:

printf("%4d-%02d-%02d", substr(Date, 8,2)+2000, (instr("---JanFebMarAprMayJunJulAugSepOctNovDec", substr(Date, 4,3))-1)/3, substr(Date, 1, 2)) as isodate

The above data definition sets the isodate column to be in the familiar and useful YYYY-MM-DD ISO format.

A related example would be to query the whole CSV file for monthly mean generation from Kingsbridge and K2 Wind projects (they’re next to one another) for months after K2’s commissioning in March 2015. Here’s what I did in q:

q -T -O -H -d, 'select printf("%4d-%02d", substr(Date, 8,2)+2000, (instr("---JanFebMarAprMayJunJulAugSepOctNovDec", substr(Date, 4,3))-1)/3) as isomonth, avg(KINGSBRIDGE) as kavg, avg(K2WIND) as k2avg from Downloads/HourlyWindFarmGen_20160122.csv where isomonth>"2015-03" group by isomonth'

which gave the results:

isomonth    kavg    k2avg
2015-04    12.7277777778    37.4569444444
2015-05    8.94623655914    67.6747311828
2015-06    6.05833333333    66.6847222222
2015-07    3.96370967742    45.372311828
2015-08    6.34811827957    67.436827957
2015-09    7.29027777778    79.7194444444
2015-10    14.5658602151    128.037634409
2015-11    15.9944444444    130.729166667
2015-12    17.6075268817    152.422043011
2016-01    19.6408730159    163.013888889

Neat! (or at least, I think so.)

Wind Power, 1940s style

smith putnam wind turbineThis is how wind turbines were supposed to look, at least in the 1940s. It’s the experimental Smith-Putnam 1.25 MW unit than ran for a short while on a hill near Rutland, VT. The picture’s from a rather falling-apart copy of Large Horizontal-axis Wind Turbines (Thresher, R. W., & Solar Energy Research Institute. (1982). Large horizontal-axis wind turbines: Proceedings of a workshop held in Cleveland, Ohio, July 28-30, 1981. Golden, Colo: Solar Energy Research Institute) that I rescued from Jim‘s recycling years ago.

The first part of these proceedings has a historical review of the Smith-Putnam turbine, including an excerpt from the S. Morgan Smith Company’s house organ on the project. As the rest of the book is pretty much all about the MOD series of turbines, it’s of less interest. I’ve scanned the bits about the Smith-Putnam turbine, and put them here: NASA_DOE-1981-large_horizontal_axis_wind_turbines-excerpt. If anyone wants the book, let me know. It’s very ratty, but readable.

I’ve written about this turbine before, but in relation to a packet of crayons. More awesome turbine pictures from Paul Gipe: Smith-Putnam Industrial Photos.

New, tall wind turbines are super-awesome, according to REF

If I said that computers got slower with age, you’d look at me as if I were deranged. But REF say effectively that about wind turbines.

My former (nutso) argument goes like this: your 30 year old Commodore 64 is so much slower than the multi-core beastie you’re reading this post on, so computers get slower as they age, amirite …? I can’t actually keep this nonsense up much longer (computers have always been as fast as the market and technology could support), but the Renewable Energy Foundation manage for about 50 pages of statistical gorp in their paper, “Analysis of Wind Farm Performance in UK and Denmark“. And oh boy does the dittosphere like to report on it, like here, here, here, here, and here.

In short, the key graph in the report is this:

ref_graph
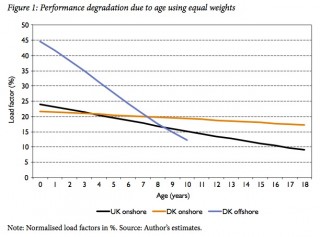
If you believe it, it shows a steady decline in wind farm output with age. But thankfully, the good chaps at REF supply all of their data (and also have a bunch of other wind farm stats lying around in easily scrapeable formats; cheers, m’dears!), so I could take a look at their claims. So I made a subset: uk_annual_ncf [ODF], which has:

  1. all the monthly stats collapsed into annual Net Capacity Factors (NCF) for 2003–2011
  2. only the sites that have full details of wind turbine model, rating, installation date, height and diameter
  3. none of the sites that have been obviously repowered, with giant NCF jumps being a giveaway
  4. minor edits to turbines specs on sites I know and likely worked on at some point.

First off, and most blatantly, there’s no correction for annual wind patterns in the REF report. Blustery Januaries are merrily correlated against balmy Augusts, so there’s a lot of noise in the data. Using only annual data for those sites with 9 full years of data aligned everything quite nicely:

NCF by Year
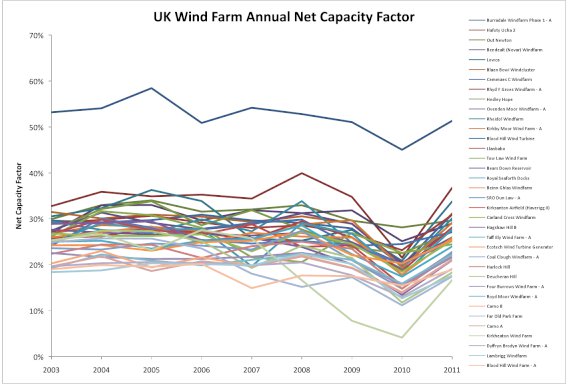
No real trends evident there, except that the wind appeared to have sucked mightily in 2010. So how about if I graph the same data, but plot it by project age at mid-year:

NCF by Age
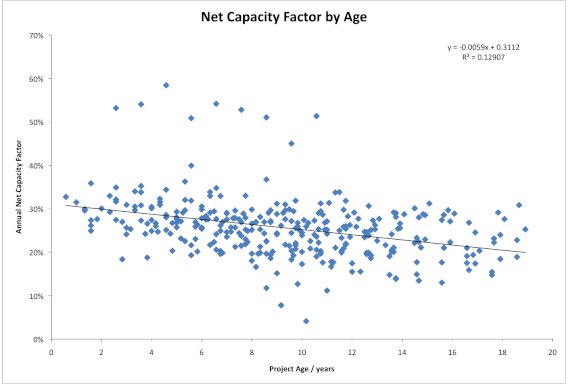
And there it is: a trend pulled from where there was none. It’s not very well correlated, but you could say that it shows a decline in NCF of about 0.6% per year. I wonder where it came from?

There’s one site that gives REF’s game away: Blood Hill, in Norfolk. It’s had 10× 225 kW Vestas V27s on 30m towers running since 1992, but it’s also got a single megawatt-class Enercon turbine on a 65 m tower which was installed in 2000. Here’s how the annual capacity factor looks for both sites:

blood hill yearly data
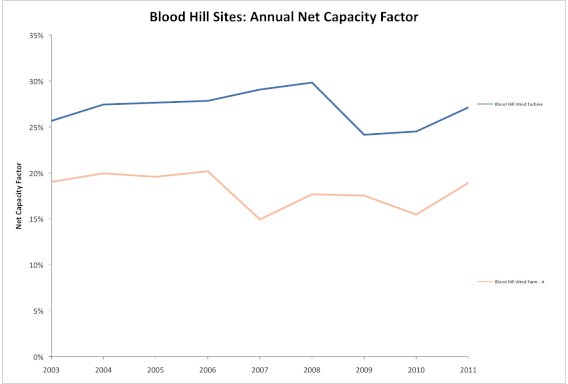
Apart from a slight maintenance wibble in 2007-2008 on the older turbines, the capacity factors track each other quite well. Remember, these turbines are nearly 20 years old at the end of the graph; according to REF, they’d be bumping along at about a third of their original capacity. So let’s graph them by age:

Blood Hill NCF by Age
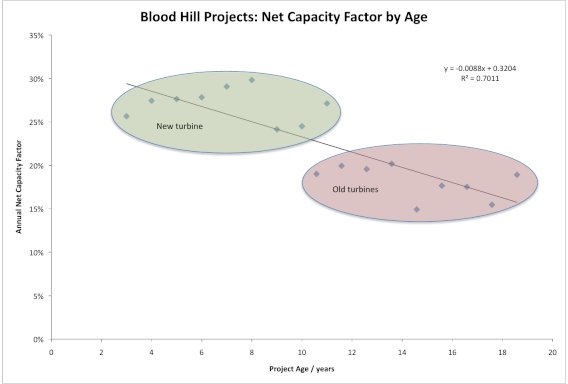
Aha! Here is the secret key (as a certain spider might say). If you compare new, tall turbines against old, small ones you get this false correlation. To show you how much wind turbines have grown, here are the average sizes for each installation year in the data set:

Year Avg Height
/ m
Avg Diameter
/ m
Avg Power
/ kW
Installed Capacity in year
/ MW
1991 32.0 34.0 400.0 4.0
1992 30.3 31.7 343.2 25.1
1993 31.8 35.2 428.0 35.1
1994 31.7 37.0 466.7 15.4
1995 35.0 44.0 600.0 15.6
1996 31.8 40.7 573.6 60.8
1997 32.3 41.3 527.7 34.3
1998 33.2 33.3 363.2 6.9
1999 40.6 45.5 647.1 18.1
2000 39.7 45.5 672.4 49.8
2001 40.9 51.6 963.9 31.8
2002 43.4 55.6 1023.1 26.6
2003 58.3 58.0 1166.7 3.5
2004 51.4 64.9 1593.5 146.6
2005 54.4 64.9 1525.7 346.3
2006 60.9 74.2 1919.5 418.5
2007 63.5 68.8 1753.4 206.9
2008 66.7 78.0 2104.4 662.9
2009 60.6 71.0 1804.4 268.9
2010 69.6 79.4 1987.8 163.0

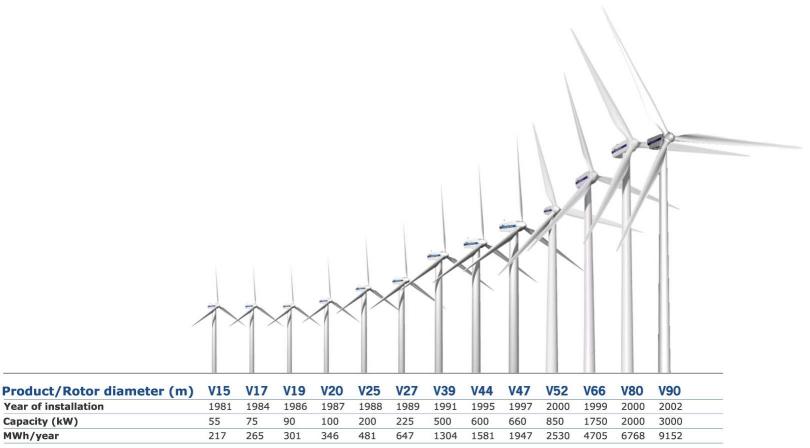
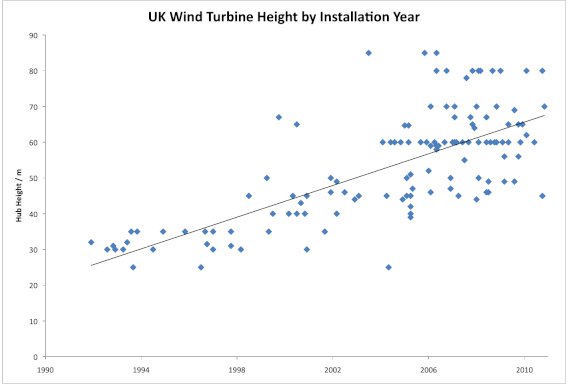
It’s clear from the table that the height, diameter, and rated power of the turbines installed in the UK have all gone up. Turbines really have got bigger over the years; just look at this old promo slide from Vestas:

vestas-turbine_size
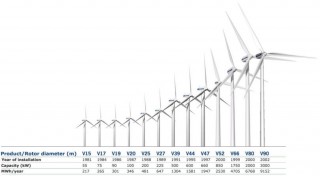
Wind turbines grew immensely; maybe not quite by Moore’s Law, but exceedingly fast for mechanical machinery. So to even compare old turbines to new is exactly like comparing your old Commodore 64 to a current computer: that’s to say, not even wrong.

This is how wind turbine hub height grows by installation year for the sites it can be reliably extracted from the REF data:

Hub Heightor if you want to look at it the way REF does, by age:

Height by Age
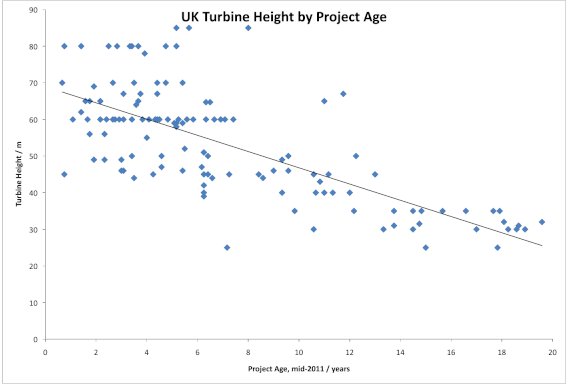
(I fully expect someone to come out with a report that says “Wind Turbines Get Smaller As They Get Older” … oh wait, REF already did.)

To compound this effect, wind speeds increase with height from the ground. So taller, newer turbines are able to harvest much more energy than shorter, older ones. What’s more, the larger a wind turbine’s rotor, the more swept area it has, so it will have even more energy available to supply to the grid. In a later post, I’ll run a simulation where, with no degradation from a wind turbine’s output, you can fake a decline just by building taller turbines every year.

In short, we can take two things from the anti-wind REF’s report:

  1. There is no gross decline in a wind project’s output with age.
  2. New, tall turbines are super-awesome compared to older, shorter ones.

The sad thing is that REF peddle this deliberately misleading crap, and some of the public believes them. The spectacularly sad thing is that I had to waste my time sleuthing my way through it all.

ExPlace Turbine Shutdown for Service

I noticed this in my twitter feed the other day:

windshare: ExPlace Turbine Shutdown for Service http://wp.me/p11wfW-8T

From what the linked news release said, it looks like the turbine has had a major mechanical component failure. The replacement part will take several months to arrive, then needs a crane to replace it. The turbine is structurally sound, and is even yawing to follow the wind, but can’t generate.

This is a shame, as the volunteers at WindShare had just got the turbine operating at very close to commercial availability. There are also a couple of usefully windy months before the summer for which co-op members will lose revenue.

Update: a very watered-down news release went up on April 3rd: Turbine Technology Update.

Why I didn’t vote for George Smitherman

I didn’t vote for George Smitherman because I fundamentally disagree with the secret deal he initiated with the Korean consortium (including Samsung and Kepco). A feed-in tariff is all about equal access to the right to connect. The consortium, with its guaranteed grid capacity, sidesteps this equal access.

To make things worse, the consortium may have access to a price adder on top of the FiT prices. This is supposed to recognize the consortium’s expertise in the supply chain, and its consequential creation of jobs through local manufacturing.  There are many other companies — some of which actually have supply chain experience in the renewable energy sector — who would bring the same number of jobs for the same number of megawatts.

So, ixnay on the Ithermansmay for that. There’s no way I’d vote for the glistening oaf (a phrase coined by Catherine after seeing this picture), so Joe Pantalone it was.  Joey Pants’ campaign was, well, a bit pants, but he was the most appropriate of the candidates.

My comments on the “Renewable Energy Approval Requirements for Off-shore Wind Facilities”

Dear Mr Duffey

EBR Registry Number: 011-0089
Renewable Energy Approval Requirements for Off-shore Wind Facilities – An Overview of the Proposed Approach

I would like to propose that the mandatory 5km shoreline exclusion be removed entirely, for the following reasons:

1 Drinking Water Source Setbacks
While the “Technical Rules: Assessment Report”1 of the
Clean Water Act 2006 is cited as a major reason for the 5km shoreline setback, the assessment report itself provides for no greater setback than 1000m from a water intake in a Great Lake. It is suggested that this one kilometre setback be maintained for existing and planned intakes, but should not be applied as a blanket distance for all development. To force a larger setback than the Act allows is to discriminate against wind energy and the industry.

2 Lake Bathymetry

Taking the particular case of Lake Ontario near Toronto, the water depth at 5km from shore is typically2 40-70m. This is far greater than is practical, and would require massive and costly foundations.

3 Noise
The proposed shoreline exclusion unscientifically precludes any project coming closer to shore. As your document states that noise guidelines for offshore projects are in development, setbacks derived from these guidelines should be allowed. The document should also clarify that the 5km shoreline exclusion is typically larger than the setback required by the
Noise Guidelines for Wind Farms3, as at a recent MOE session on Low Frequency Noise Measurement4, representatives of “The Society for Wind Vigilance” stated that 5km was now the setback recommended by the MOE for all wind projects.

4 Positive Visual Enhancement
Wind energy is the most visual form of electrical generation, and it is a subjective matter as to whether the turbines are ugly or beautiful. The major shoreline constraint cited by the Ohio Department of Natural Resources is due to “aesthetic hindrance”5, yet the Great Lakes Wind Energy Center’s Final Feasibility Report6 wishes to site their pilot turbine as close to shore for “the highest iconic value”. Copenhagen, the capital city of Denmark, has an arc of wind turbines in the bay approximately 3km from the shore, and less than 5km from the Amalienborg Palace. By placing these turbines close to the city, they have made a statement of their commitment to sustainability, and avoided rows of pylons, which few (if any) could call anything but ugly.

I would hope that you would take my comments into account.

Yours sincerely,

Stewart C. Russell, P.Eng.

References:

4 12th August – 2300 Yonge St – 9:30-11:30am.

Offshore Wind: much of Copenhagen is within 5km of offshore wind turbines

There’s a bit of a stooshie going on in Ontario renewables circles about a proposed 5km minimum shoreline setback for offshore wind turbines in the Great Lakes. This pretty much kills most projects through infrastructure costs — deep lake foundations are expensive, as is submarine cable. Please express your opposition.

I’ve flown over Middelgrunden, and found it to be an icon in Copenhagen’s harbour. With some freehand tracing in Google Earth and some minor GIS skills (hey, I’m learning), here’s how much of Copenhagen is within 5km of the turbines:

That looks like quite a lot; lots of homes and tourist attractions, and not just the harbour. If you want a closer look, here’s the buffer in KML format: Middelgrunden-5km.kml.

I’m trying to find the location of the turbine 500m from shore at Hooksiel, but maybe it’s a bit new for Google Earth imagery. Fixed that for me:

File: BARD Hooksiel 5km buffer.kml

International panel of experts conclude sound from wind turbines has no harmful effect on human health

Wind Turbine Sound and Health Effects: An Expert Panel Review [PDF]

Executive summary:

People have been harnessing the power of the wind for more than 5,000 years. Initially used widely for farm irrigation and millworks, today’s modern wind turbines produce electricity in more than 70 countries. As of the end of 2008, there were approximately 120,800 megawatts of wind energy capacity installed around the world.

Wind energy enjoys considerable public support, but it also has its detractors, who have publicized their concerns that the sounds emitted from wind turbines cause adverse health consequences.

In response to those concerns, the American and Canadian Wind Energy Associations (AWEA and CanWEA) established a scientific advisory panel in early 2009 to conduct a review of current literature available on the issue of perceived health effects of wind turbines. This multidisciplinary panel is comprised of medical doctors, audiologists, and acoustical professionals from the United States, Canada, Denmark, and the United Kingdom. The objective of the panel was to provide an authoritative reference document for legislators, regulators, and anyone who wants to make sense of the conflicting information about wind turbine sound.

The panel undertook extensive review, analysis, and discussion of the large body of peer-reviewed literature on sound and health effects in general, and on sound produced by wind turbines. Each panel member contributed a unique expertise in audiology, acoustics, otolaryngology, occupational/ environmental medicine, or public health. With a diversity of perspectives represented, the panel assessed the plausible biological effects of exposure to wind turbine sound.

Following review, analysis, and discussion of current knowledge, the panel reached consensus on the following conclusions:

  • There is no evidence that the audible or sub-audible sounds emitted by wind turbines have any direct adverse physiological effects.
  • The ground-borne vibrations from wind turbines are too weak to be detected by, or to affect, humans.
  • The sounds emitted by wind turbines are not unique. There is no reason to believe, based on the levels and frequencies of the sounds and the panel’s experience with sound exposures in occupational settings, that the sounds from wind turbines could plausibly have direct adverse health consequences.

International panel of experts conclude sound from wind turbines has no harmful effect on human health – CanWEA news release

Wind gets clean bill of health – thestar.com