But as ever, hand-picked statistics only tell half the story. Digging into the IEA Key World Energy Statistics handbooks for 2011 and 2012, the data look something more like this:
Country
2010 Domestic Electricity Price / USD/kWh
2010 Annual Electricity Consumption per capita / kWh
Annual Cost per capita
Denmark
$0.356
6,329
$2,255
Japan
$0.232
8,399
$1,950
United Kingdom
$0.199
5,741
$1,142
France
$0.157
7,756
$1,216
United States
$0.116
13,361
$1,547
Canada
$0.095
15,145
$1,431
Mexico
$0.089
2,085
$185
So really, because Canadians use such an obscene amount of energy per capita (srsly; we should be ashamed of ourselves), the graph should look more like this:
So we’re not actually that inexpensive; solidly mid-range. Since our electricity price per kWh is so low, if we spent a little money on energy conservation, we could have really cheap power for everyone.
NB: this is in the early stages of development, but does work. It’s by no means a plug-and-play solution. You’re going to have to do some coding, and perhaps some soldering. Undaunted? Read on …
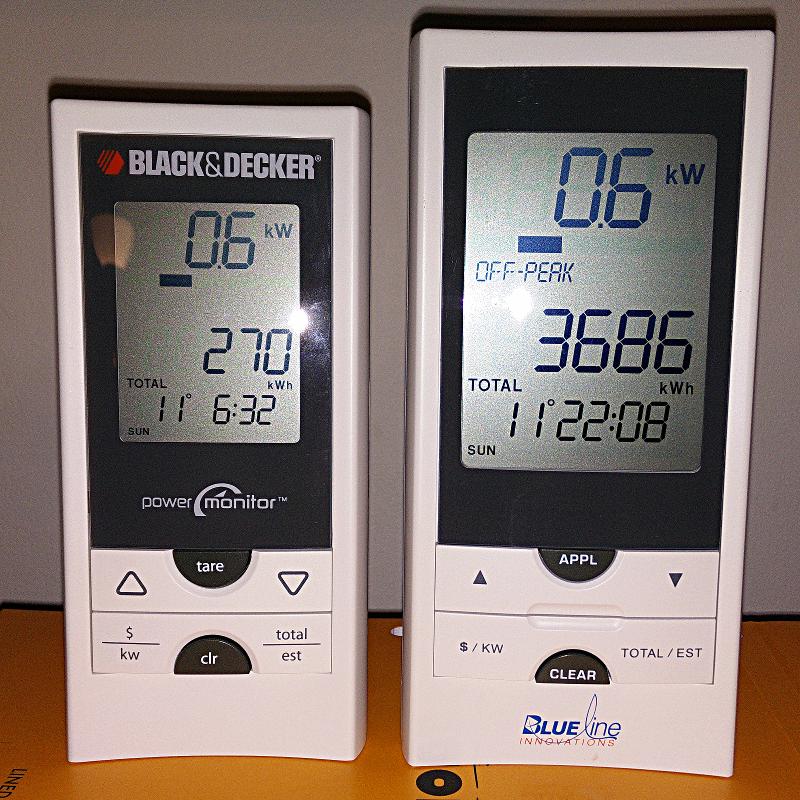
I really like the Blue Line Innovations PowerCost Monitorâ„¢ (aka the Black & Decker Power Monitor EM100B). I bought one long before the OPA started to give them away free to Ontario households as part of their peaksaver PLUS program. It’s a little device that clamps to your hydro meter and sends instantaneous power readings to a display.
Power Monitor displays — Black & Decker on the left, Blueline on the right
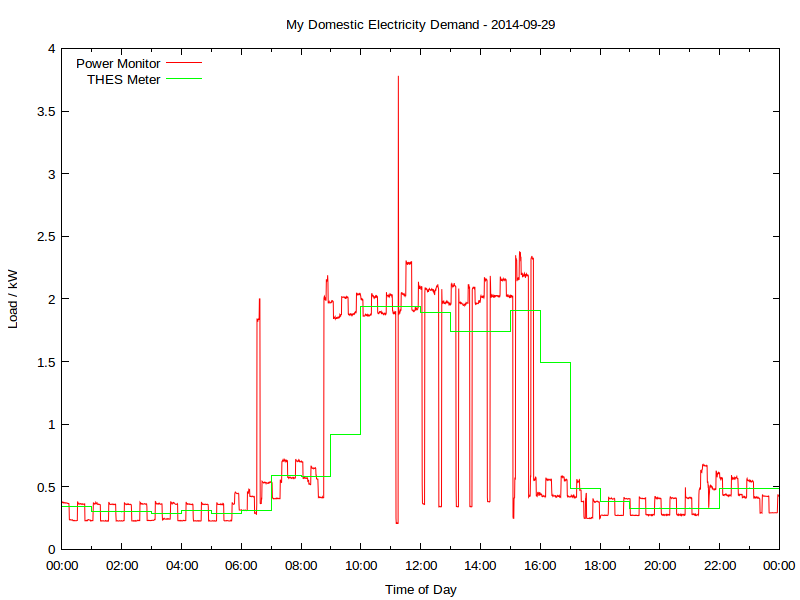
Wouldn’t it be so much better if you could log and analyze these data? So a day’s power consumption might graph to something like this:
Yup, this is my real electricity consumption, as logged from the PowerCost Monitor. You can see the fridge cycling on and off, and I think the big mid-day spike was either the AC or the dryer; someone was home on that Monday. The rather blocky green line is Toronto Hydro’s hourly smart meter data. It really hasn’t got the resolution to show really detailed power use.
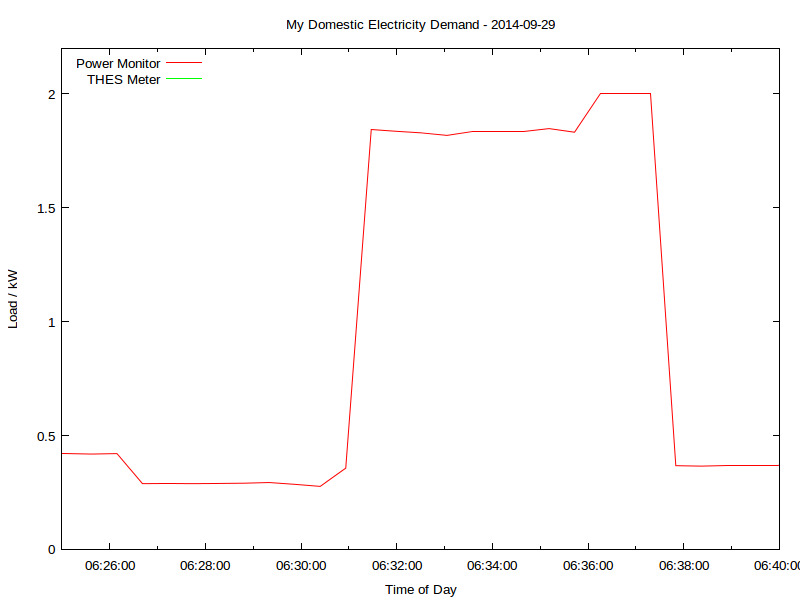
That spike at 06:30; what’s that? Let’s take a look:
That’s me boiling the kettle. You can see that the time resolution is better than a minute, and the power is to the watt. Mmm, coffee …
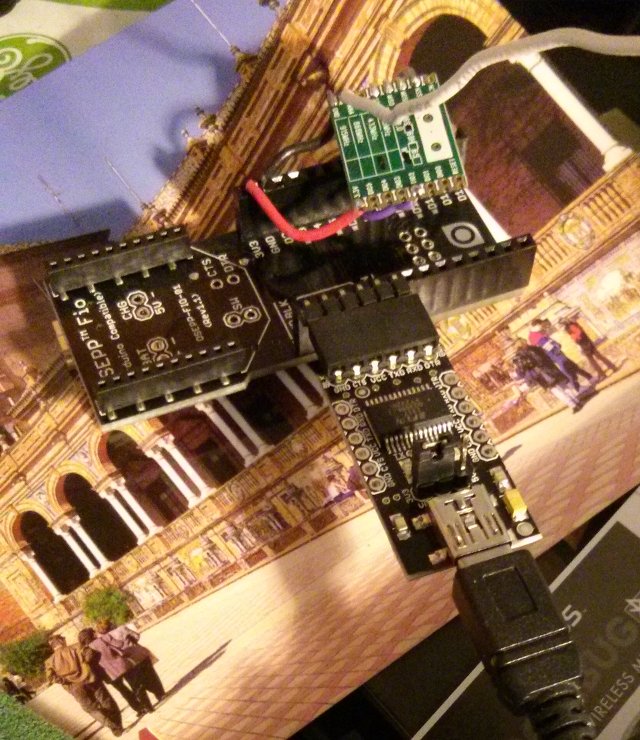
All of this is recorded using a simple Arduino-based solution, originally cooked up by Bryan Mayland. I’ve forked his code and added some instructions: scruss/Powermon433. Here’s the rig I’ve been using to log data over a USB serial link:
Arduino FIO compatible + RFM69W board + FTDI serial
That’s a particularly ugly rig, due to the limitations of the 3.3 V receiver board I was using. There are other options that work with more normal Arduino boards up on github.
Here’s a sample of the data I’m logging, including the kettle incident:
Datetime
Elapsed_s
Energy_Wh
Power_W
Temp_C
2014-09-29T06:27:44
23241.7
25876
289
15
2014-09-29T06:28:16
23273.6
25876
290
15
2014-09-29T06:28:48
23305.5
25876
291
15
2014-09-29T06:29:20
23337.4
25892
294
15
2014-09-29T06:29:52
23369.2
25892
286
15
2014-09-29T06:30:24
23401.1
25892
277
15
2014-09-29T06:30:56
23433.0
25892
357
15
2014-09-29T06:31:28
23464.9
25892
1844
15
2014-09-29T06:32:00
23496.8
25892
1836
15
2014-09-29T06:32:31
23528.5
25952
1829
15
2014-09-29T06:33:03
23560.2
25952
1818
15
2014-09-29T06:33:35
23592.1
25952
1836
15
2014-09-29T06:34:07
23624.0
25952
1836
15
2014-09-29T06:34:39
23655.8
25952
1836
15
2014-09-29T06:35:11
23687.7
25952
1848
15
2014-09-29T06:35:43
23719.6
26048
1832
15
2014-09-29T06:36:15
23751.5
26048
2000
15
2014-09-29T06:36:46
23783.4
26048
2000
15
2014-09-29T06:37:18
23815.2
26048
2000
15
2014-09-29T06:37:50
23846.9
26048
368
15
You’ll see that I’m recording:
a system timestamp
the elapsed logging time, from the Arduino’s clock
instantaneous meter readings in watt-hours. Note that not every row has an update
the average power since the last record. The product of this and the time between records adds up to the energy consumption
the outside temperature in °C. This is not very accurate (in full sun it over-reads vastly) but better than nothing.
Compare that to the smart meter data:
DateTime
Hour
KwhUsage
Cost
Rate
2014-09-29 05:00:00
5
0.29
$0.02
$0.075
2014-09-29 06:00:00
6
0.31
$0.02
$0.075
2014-09-29 07:00:00
7
0.59
$0.04
$0.075
Not much data there, is there? Certainly not enough resolution to tell if a kettle has been running.
Even though this interface is homebrew and cheap, it is accurate. Here’s how four days of continuous readings stack up against Toronto Hydro’s meter:
Â
Power Monitor
ndToronto Hydro Smart Meter
Day
First Reading / Wh
Last Reading / Wh
Total Consumption / kWh
No of readings
Daily Total / kWh
No of readings
2014-09-29
23896
43668
19.772
2711
19.77
24
2014-09-30
43668
52500
8.832
2710
8.82
24
2014-10-01
52500
68004
15.504
2711
15.51
24
2014-10-02
68004
81996
13.992
2712
13.99
24
The difference looks to me like aliasing; THES’s reporting is much more granular.
I’m going to develop this further to turn it into an easy (or at least, easier) to use logging platform. It’s taken us a few years to get here, but there’s nothing quite like a project finally working!
I just signed up for Toronto Hydro‘s Time-of-Use (TOU) Metering programme. While it was mentioned in this month’s PowerWISE (hey, am I the only one who reads the info inserts that comes with their bill?), it doesn’t seem to have been officially launched. On first look, it’s fairly nifty (click the image for a full-sized view):
Since I’m a Bullfrog customer, I don’t think I get charged TOU rates (hey, it’d be nice; actually, if coupled to current capacity, I’d make hay while the sun shines/wind blows/water flows …) but at least I get to see the data. I wonder if the front end is scriptable? I’d love to be able to track my usage day by day.
(And to think, yesterday I was on the cusp of buying a Black & Decker Power Monitor. If it had ethernet/wireless/bluetooth, I’d have been on it like an X on a Thing That X Likes. It looks a bit complex to install.)
 But as ever, hand-picked statistics only tell half the story. Digging into the IEA Key World Energy Statistics handbooks for 2011 and 2012, the data look something more like this:
 So we’re not actually that inexpensive; solidly mid-range. Since our electricity price per kWh is so low, if we spent a little money on energy conservation, we could have really cheap power for everyone.