Utility Meter Reader: nice idea, flawed implementation

Utility Meter Reader is a great idea for an app. Using the camera on your smartphone, snap a picture of your utility meter’s analogue dials, and through the power of some clever image processing, the app will return your meter reading. five-dial analogue kWh meter fasciaTraditional meters are a bit hard to read, as the dials rotate in alternate directions. You won’t realize why this is unless you get a chance to peek behind the fascia:
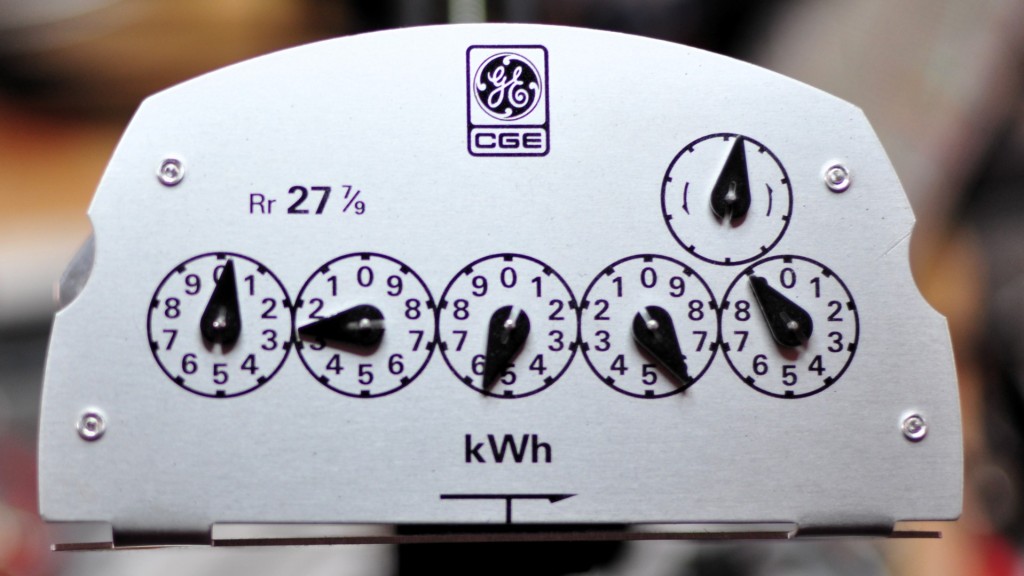
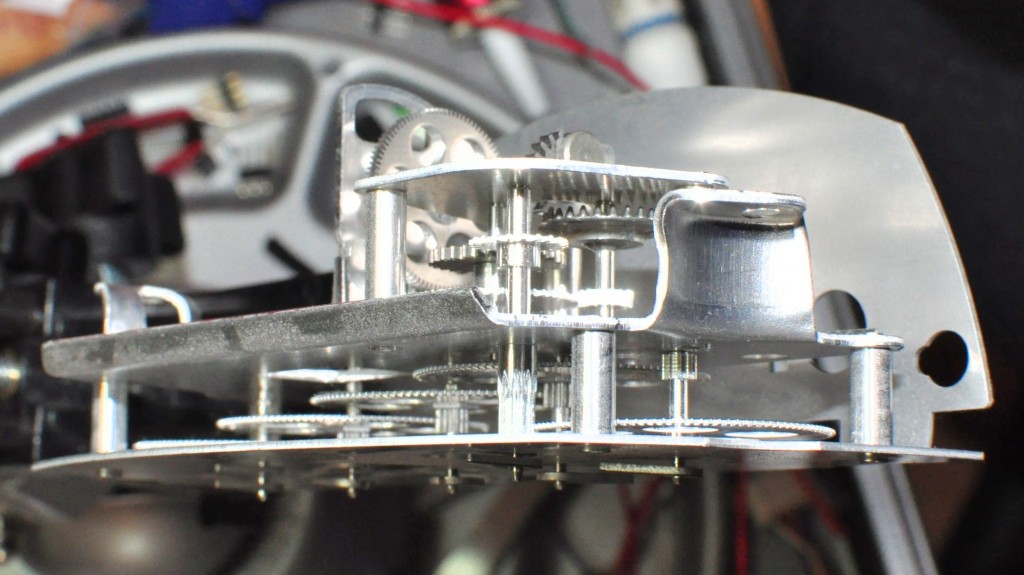
the fiddly gear-train inside a five-dial analogue kWh meterThere’s an incredibly fiddly set of 10:1 reduction gears in there, so each dial registers a tenth of the one next to it. Because it’s a drive-train, adjacent shafts rotate in opposite directions. This serves to keep the cost of the meter down at the expense of having to think a bit about how to read the thing.

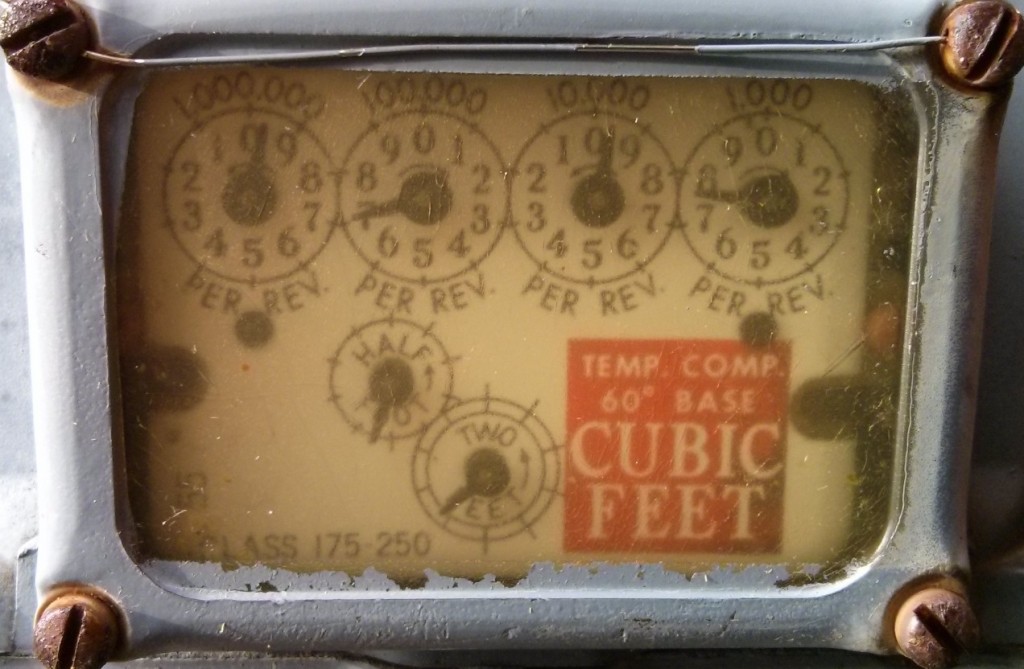
We only have one dial meter on the house. It’s a 58 year old gas meter (same age as the house) and it’s certainly been around a bit:

gas meter (but not Scarlett O'Gasmeter)

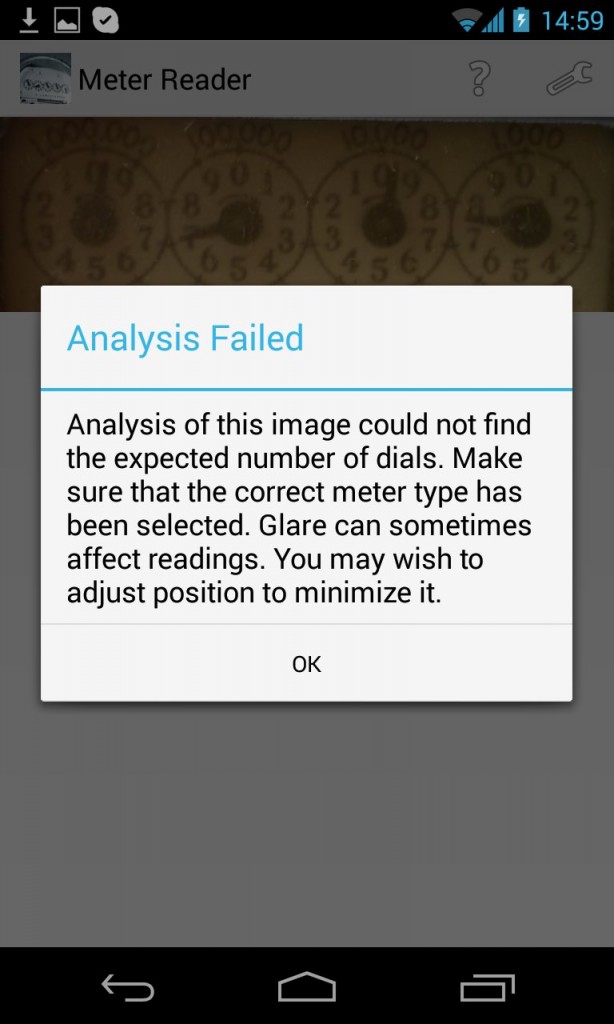
Here it’s reading 969700 ft³, ignoring the lower dials; the units are hundreds of cubic feet. Let’s see how Utility Meter Reader made out with that:

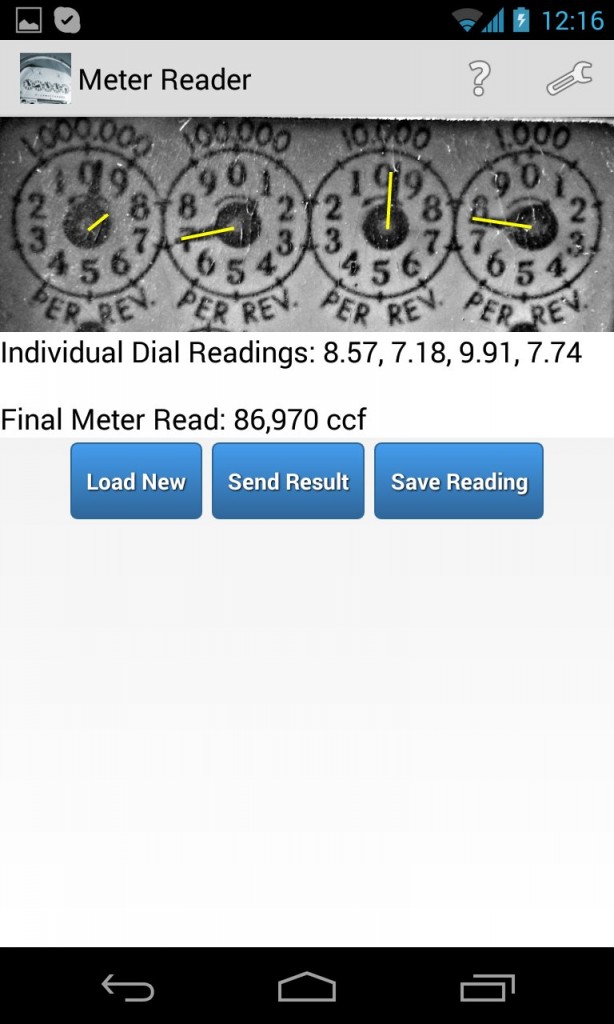
meter read failed

Not very well, it seems. How about if I carefully process the image, sharpening it up, straightening it, and making it very high-contrast greyscale:

not quite right: gas meter

Hmm, the big figure’s completely wrong, but it got the rest.

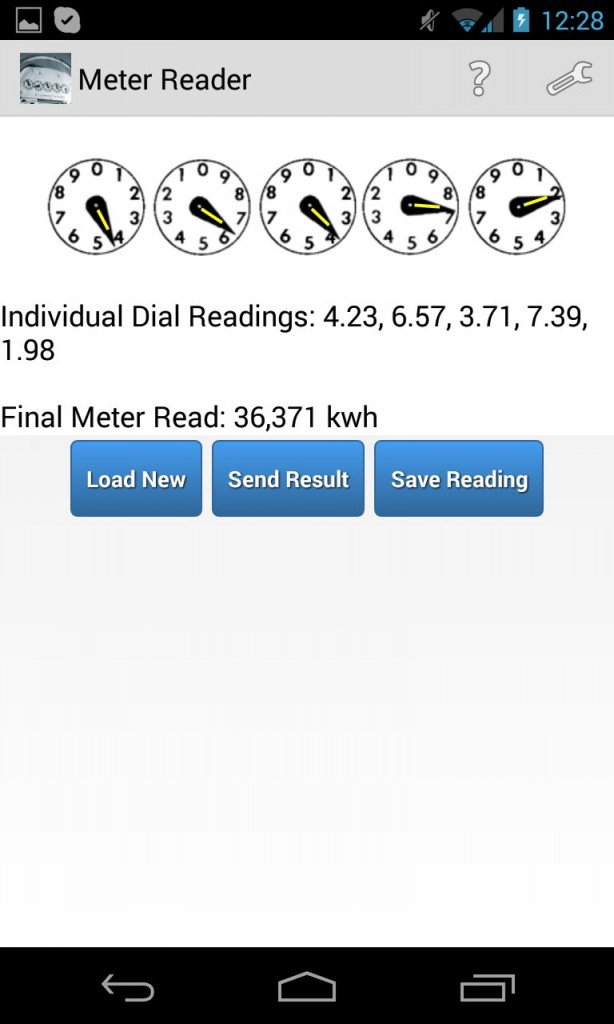
Okay, so let’s feed it a nice canned example, like this one (courtesy of Greeneville Light & Power System‘s “How to Read Your Electric Meter” page). Even I can see that this reads 46372:

glps.net-sm46372According to Utility Meter Reader, though:

2013-10-21_16.28.15

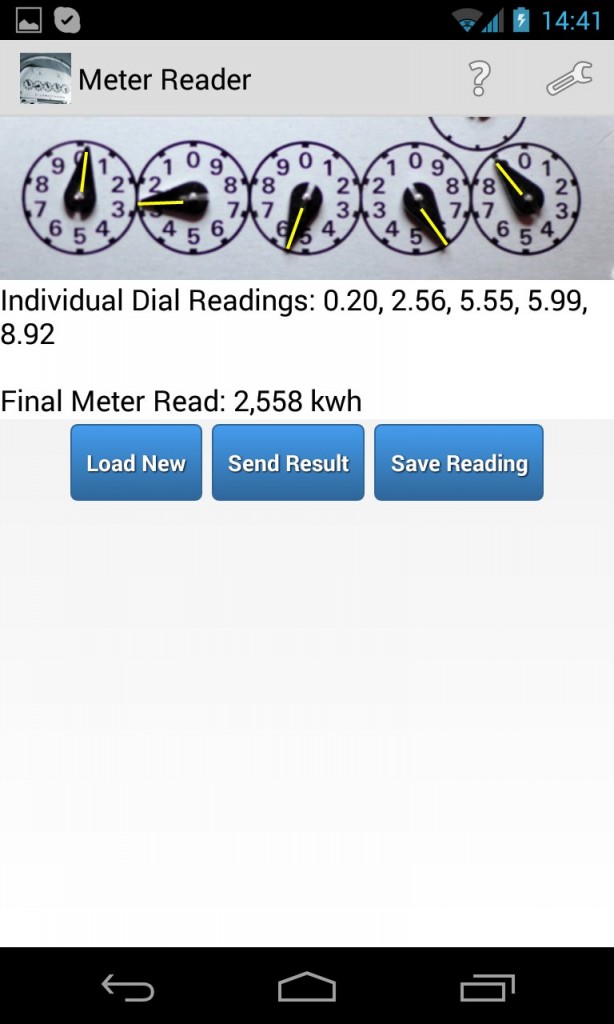
The big figure’s off by one again. Very strange, especially since it picked up 4.23 for the first dial. In desperation, I clipped a small part of the GE meter image from my screen, and sent it to the app:

2013-10-21_18.41.11

2558 is the right answer. Phew! But the app only seemed to work on a well-lit, clean meter fascia with no glass in the way and an image taken by a rather nice DSLR. One out of three ain’t quite good enough.

One concern I have about the app is that — while it allows you to e-mail a reading to your utility — it quietly BCCs a copy of that reading (which includes your meter details) to imeterreader [at] the-next-future.com. I didn’t see much of a privacy contract when I downloaded the app onto my Android phone, so I don’t know what they are going to do with my readings or personal data. So if it ever gets to working properly, I won’t use that feature.

The app’s a good idea, but the implementation’s pretty far off where it needs to be. Of course, one could quickly whip up an implementation in OpenCV to identify dial circles and read the pointers. But do all this on your smartphone, however, and you’d fall foul of their US patent application.
smarter meter

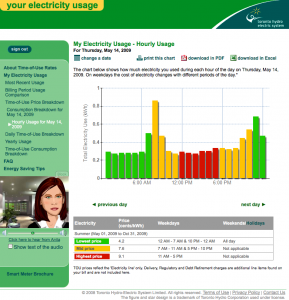
I just signed up for Toronto Hydro‘s Time-of-Use (TOU) Metering programme. While it was mentioned in this month’s PowerWISE (hey, am I the only one who reads the info inserts that comes with their bill?), it doesn’t seem to have been officially launched.  On first look, it’s fairly nifty (click the image for a full-sized view):
daily TOU breakdown hourly
Since I’m a Bullfrog customer, I don’t think I get charged TOU rates (hey, it’d be nice; actually, if coupled to current capacity, I’d make hay while the sun shines/wind blows/water flows …) but at least I get to see the data. I wonder if the front end is scriptable? I’d love to be able to track my usage day by day.

(And to think, yesterday I was on the cusp of buying a Black & Decker Power Monitor. If it had ethernet/wireless/bluetooth, I’d have been on it like an X on a Thing That X Likes. It looks a bit complex to install.)

nine in the bed, and the little one said …

I don’t know if this is worth posting to RISKS:

I used to manage wind farm SCADA systems. The supplier is a market leader in the wind industry. The components used to feed data to the central SCADA are industry standard, accurate, reliable units. The complete cost of the SCADA system and associated metering probably runs into the hundreds of thousands of dollars. This isn’t el cheapo stuff, and is put together by knowledgeable engineers and technicians.

So I was a little surprised to see that the generation report for a wind farm was showing a total of -8.3 GWh, when a similar wind farm nearby had generated 1.8 GWh for the same period. What!? Crossed wires on the meter? Inconceivable!

No wires were harmed in the making of this error. For metering power delivered, power plants use interval meters, which behave extremely similarly to your household electrical meter. They’re a little more accurate, have a few more features (like these ones have ethernet ports for remote reading) but they’re basically the same: any energy that goes through the wires gets added up on a counter. Take two readings a known time apart, subtract the later from the earlier, and you’ve got the total energy delivered.

The wind farm’s SCADA polls this meter every ten minutes, and stores the result in its database. When you want a generation report, the server goes through the data, subtracts the last reading from the first, and presents that as the generation. Simple; what could go wrong?

The bods at Major Wind Turbine Company were baffled. I was confused, and a little annoyed as I had lender and a board of directors breathing down my neck for revenue numbers. So I dug into the raw ten-minute data, and found this:

kWh Delivered
Wind Farm A Wind Farm B
T=0 9523886 9999237
T+10 min 9525238 575
Difference 1352 -9998662

It doesn’t take a genius to realise that the meter at Wind Farm B rolled over at 9,999,999 kWh, and so should really have read 10,000,575 kWh. The poor little SCADA didn’t know to check for rollover, and happily subtracted the later number from the earlier.

I should add that there was no risk to public safety or system operation caused by this error. Just a few lost hairs from me.

(Actually, many years ago, I had access to the source of an extremely early wind farm SCADA server. It was written by a series of summer students, with variable names and comments in their native language. It was pretty hard to follow. One little nugget I did pry out of the code was that they used a simple arithmetic mean for averaging wind direction. That meant that it took the mean of 358° and 2° to be 180°; not so smart …)