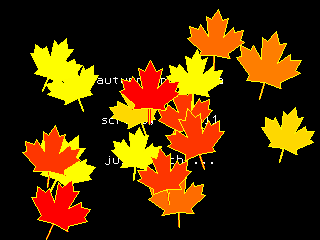
So I ported autumn in canada from OpenProcessing to PicoMite BASIC on the Raspberry Pi Pico:


The biggest thing that tripped me up was that PicoMite BASIC starts arrays at 0. OPTION BASE 1 fixes that oversight. It would have been nice to have OpenProcessing’s HSV colour space, and an editor that could handle lines longer than 80 characters that didn’t threaten to bomb out if you hit the End key, but it’ll serve.
Source below:
' autumn in canada
' scruss, 2021-11
' a take on my https://openprocessing.org/sketch/995420 for picomite

OPTION base 1
RANDOMIZE TIMER
' *** initialize polar coords of leaf polygon and colour array
DIM leaf_rad(24), leaf_ang(24), px%(24), py%(24)
FOR i=1 TO 24
    READ leaf_rad(i)
NEXT i
FOR i=1 TO 24
    READ x
    leaf_ang(i)=RAD(x)
NEXT i

DIM integer c%(8)
FOR i=1 TO 8
    READ r%, g%, b%
    c%(i)=RGB(r%,g%,b%)
NEXT i

' *** set up some limits
min_scale%=INT(MIN(MM.HRES, MM.VRES)/8)
max_scale%=INT(MIN(MM.HRES, MM.VRES)/6)
min_angle=-30
max_angle=30
min_x%=min_scale%
min_y%=min_x%
max_x%=MM.HRES - min_x%
max_y%=MM.VRES - min_y%

CLS
TEXT MM.HRES/2, INT(MM.VRES/3), "autumn in canada", "CM"
TEXT MM.HRES/2, INT(MM.VRES/2), "scruss, 2021-11", "CM"
TEXT MM.HRES/2, INT(2*MM.VRES/3), "just watch ...", "CM"

kt%=0
DO
    cx% = min_x% + INT(RND * (max_x% - min_x%))
    cy% = min_y% + INT(RND * (max_y% - min_y%))
    angle = min_angle + RND * (max_angle - min_angle)
    sc% = min_scale% + INT(RND * (max_scale% - min_scale%))
    col% = 1 + INT(RND * 7)
    leaf cx%, cy%, sc%, angle, c%(7), c%(col%)
    kt% = kt% + 1
LOOP UNTIL kt% >= 1024

END

SUB leaf x%, y%, scale%, angle, outline%, fill%
    FOR i=1 TO 24
        px%(i) = INT(x% + scale% * leaf_rad(i) * COS(RAD(angle)+leaf_ang(i)))
        py%(i) = INT(y% - scale% * leaf_rad(i) * SIN(RAD(angle)+leaf_ang(i)))
    NEXT i
    POLYGON 24, px%(), py%(), outline%, fill%
END SUB

' radii
DATA 0.536, 0.744, 0.608, 0.850, 0.719
DATA 0.836, 0.565, 0.589, 0.211, 0.660, 0.515
DATA 0.801, 0.515, 0.660, 0.211, 0.589, 0.565
DATA 0.836, 0.719, 0.850, 0.608, 0.744, 0.536, 1.000
' angles
DATA 270.000, 307.249, 312.110, 353.267, 356.540
DATA 16.530, 18.774, 33.215, 3.497, 60.659, 72.514
DATA 90.000, 107.486, 119.341, 176.503, 146.785, 161.226
DATA 163.470, 183.460, 186.733, 227.890, 232.751, 270.000, 270.000
' leaf colours
DATA 255,0,0, 255,36,0, 255,72,0, 255,109,0
DATA 255,145,0, 255,182,0, 255,218,0, 255,255,0
You could probably use AUTOSAVE and paste the text into the PicoMite REPL. I used an ILI9341 SPI TFT LCD Touch Panel with my Raspberry Pi Pico along with some rather messy breadboard wiring.
Fun fact: the maple leaf polygon points are derived from the official definition of the flag of Canada.