


Simulated (and not quite right yet) output from a “HOOT-NANNY” or Magic Designer, a proto-Spirograph toy that drew six-sided curves on round paper sheets. It was made by Howard B. Jones and Co. of Chicago, IL and first sold in 1929. The company’s better known for producing Jones Plugs and Sockets, sometimes known as Cinch-Jones connectors. The “HOOT-NANNY” name was dropped when production moved to the Northern Signal Company of Saukville, WI.
My eBay-acquired Magic Designer is quite beaten up, and doesn’t always produce accurate results. Here’s how one should look, from the instruction pamphlet:

As far as I’ve been able to work out, the parameters of the machine are:
If we model the toy with a fixed turntable:
Here’s a very simple model in Python that emits a hard-coded (but editable) pattern in HP-GL: Slightly imperfect Python simulation of the “HOOT-NANNY” (or Magic Designer) drawing toy (static local copy: hootnanny.zip). It doesn’t do anything with the fixed circle studs (yet)

It’s unlikely anyone wanted a faux-lineprinter ASCII art calendar for 2022, but you’re getting one anyway. You can print this yourself:
If you want to make your own, here’s a script: snoopycal.sh
Credits:

Something has gone very wrong with the database encoding on this blog after a recent update, so all my lovely UTF-8 characters have gone mojibake.
Trying to find ways to fix it. It may have to be manual. Remember, kids: have backups before letting WordPress upgrade!
Here’s the Python equivalent of what I think the database has done:
bytes("I ???? UTF-8", encoding='utf-8').decode(encoding='cp1252')
'I 💔 UTF-8'
Quite why my hosting thought a character encoding from last century was appropriate, I’ll never know.
Update, November 2023: kinda-sort fixed the backend, but the encoding is still weird — can we…?

… only to realize I don’t really like circular key grids.


So I ported autumn in canada from OpenProcessing to PicoMite BASIC on the Raspberry Pi Pico:


The biggest thing that tripped me up was that PicoMite BASIC starts arrays at 0. OPTION BASE 1 fixes that oversight. It would have been nice to have OpenProcessing’s HSV colour space, and an editor that could handle lines longer than 80 characters that didn’t threaten to bomb out if you hit the End key, but it’ll serve.
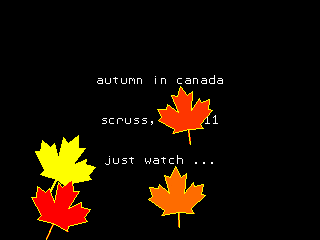
Source below:
' autumn in canada
' scruss, 2021-11
' a take on my https://openprocessing.org/sketch/995420 for picomite
OPTION base 1
RANDOMIZE TIMER
' *** initialize polar coords of leaf polygon and colour array
DIM leaf_rad(24), leaf_ang(24), px%(24), py%(24)
FOR i=1 TO 24
READ leaf_rad(i)
NEXT i
FOR i=1 TO 24
READ x
leaf_ang(i)=RAD(x)
NEXT i
DIM integer c%(8)
FOR i=1 TO 8
READ r%, g%, b%
c%(i)=RGB(r%,g%,b%)
NEXT i
' *** set up some limits
min_scale%=INT(MIN(MM.HRES, MM.VRES)/8)
max_scale%=INT(MIN(MM.HRES, MM.VRES)/6)
min_angle=-30
max_angle=30
min_x%=min_scale%
min_y%=min_x%
max_x%=MM.HRES - min_x%
max_y%=MM.VRES - min_y%
CLS
TEXT MM.HRES/2, INT(MM.VRES/3), "autumn in canada", "CM"
TEXT MM.HRES/2, INT(MM.VRES/2), "scruss, 2021-11", "CM"
TEXT MM.HRES/2, INT(2*MM.VRES/3), "just watch ...", "CM"
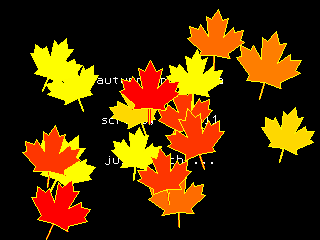
kt%=0
DO
cx% = min_x% + INT(RND * (max_x% - min_x%))
cy% = min_y% + INT(RND * (max_y% - min_y%))
angle = min_angle + RND * (max_angle - min_angle)
sc% = min_scale% + INT(RND * (max_scale% - min_scale%))
col% = 1 + INT(RND * 7)
leaf cx%, cy%, sc%, angle, c%(7), c%(col%)
kt% = kt% + 1
LOOP UNTIL kt% >= 1024
END
SUB leaf x%, y%, scale%, angle, outline%, fill%
FOR i=1 TO 24
px%(i) = INT(x% + scale% * leaf_rad(i) * COS(RAD(angle)+leaf_ang(i)))
py%(i) = INT(y% - scale% * leaf_rad(i) * SIN(RAD(angle)+leaf_ang(i)))
NEXT i
POLYGON 24, px%(), py%(), outline%, fill%
END SUB
' radii
DATA 0.536, 0.744, 0.608, 0.850, 0.719
DATA 0.836, 0.565, 0.589, 0.211, 0.660, 0.515
DATA 0.801, 0.515, 0.660, 0.211, 0.589, 0.565
DATA 0.836, 0.719, 0.850, 0.608, 0.744, 0.536, 1.000
' angles
DATA 270.000, 307.249, 312.110, 353.267, 356.540
DATA 16.530, 18.774, 33.215, 3.497, 60.659, 72.514
DATA 90.000, 107.486, 119.341, 176.503, 146.785, 161.226
DATA 163.470, 183.460, 186.733, 227.890, 232.751, 270.000, 270.000
' leaf colours
DATA 255,0,0, 255,36,0, 255,72,0, 255,109,0
DATA 255,145,0, 255,182,0, 255,218,0, 255,255,0
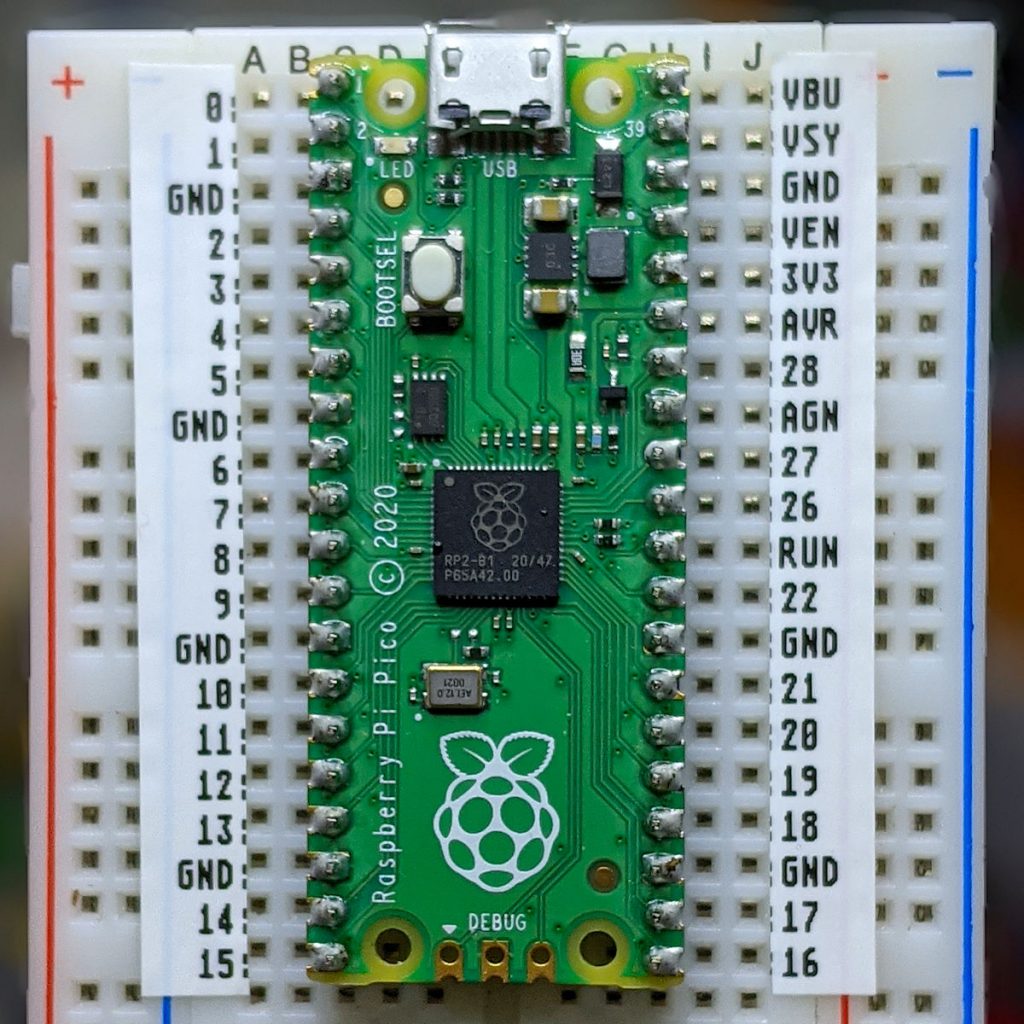
You could probably use AUTOSAVE and paste the text into the PicoMite REPL. I used an ILI9341 SPI TFT LCD Touch Panel with my Raspberry Pi Pico along with some rather messy breadboard wiring.
Fun fact: the maple leaf polygon points are derived from the official definition of the flag of Canada.

This worked better than I expected. The tricky parts are trimming the edges and getting it them straight.
Here’s the image to print on your label maker:


Slides from last night’s talk:
It’s impossible to have a Raspberry Pi Zero overheat unless you overclock it. That’s why you don’t get any cases for it with fans or heat sinks. The quad-core Raspberry Pi Zero 2 W, though, has the potential to do so. Here are some numbers:


Unless you’re doing things that might indicate you should be using a bigger computer, a Raspberry Pi Zero 2 W won’t overheat and doesn’t need any form of cooling. If you’re overclocking, well … it’s your choice to have cooling equipment worth more than the computer it’s trying to cool.

What you can’t see is the smell of Halloween: the hum of charred turnip from the candle inside.
Running A Pi Pie Chart turned out some useful performance numbers. It’s almost, but not quite, a Raspberry Pi 3B in a Raspberry Pi Zero form factor.
Running stock Raspberry Pi OS with desktop, compiled with stock options:


time ./pichart-openmp -t "Zero 2W, OpenMP" pichart -- Raspberry Pi Performance OPENMP version 36 Prime Sieve P=14630843 Workers=4 Sec=2.18676 Mops=427.266 Merge Sort N=16777216 Workers=8 Sec=1.9341 Mops=208.186 Fourier Transform N=4194304 Workers=8 Sec=3.10982 Mflops=148.36 Lorenz 96 N=32768 K=16384 Workers=4 Sec=4.56845 Mflops=705.102 The Zero 2W, OpenMP has Raspberry Pi ratio=8.72113 Making pie charts...done. real 8m20.245s user 15m27.197s sys 0m3.752s ----------------------------- time ./pichart-serial -t "Zero 2W, Serial" pichart -- Raspberry Pi Performance Serial version 36 Prime Sieve P=14630843 Workers=1 Sec=8.77047 Mops=106.531 Merge Sort N=16777216 Workers=2 Sec=7.02049 Mops=57.354 Fourier Transform N=4194304 Workers=2 Sec=8.58785 Mflops=53.724 Lorenz 96 N=32768 K=16384 Workers=1 Sec=17.1408 Mflops=187.927 The Zero 2W, Serial has Raspberry Pi ratio=2.48852 Making pie charts...done. real 7m50.524s user 7m48.854s sys 0m1.370s
Running stock/beta 64-bit Raspberry Pi OS with desktop. Curiously, these ran out of memory (at least, in oom-kill‘s opinion) with the desktop running, so I had to run from console. This also meant it was harder to capture the program run times.
The firmware required to run in this mode should be in the official distribution by now.


pichart -- Raspberry Pi Performance OPENMP version 36 Prime Sieve P=14630843 Workers=4 Sec=1.78173 Mops=524.395 Merge Sort N=16777216 Workers=8 Sec=1.83854 Mops=219.007 Fourier Transform N=4194304 Workers=4 Sec=2.83797 Mflops=162.572 Lorenz 96 N=32768 K=16384 Workers=4 Sec=2.66808 Mflops=1207.32 The Zero2W-64bit has Raspberry Pi ratio=10.8802 Making pie charts...done. ------------------------- pichart -- Raspberry Pi Performance Serial version 36 Prime Sieve P=14630843 Workers=1 Sec=7.06226 Mops=132.299 Merge Sort N=16777216 Workers=2 Sec=6.75762 Mops=59.5851 Fourier Transform N=4194304 Workers=2 Sec=7.73993 Mflops=59.6095 Lorenz 96 N=32768 K=16384 Workers=1 Sec=9.00538 Mflops=357.7 The Zero2W-64bit has Raspberry Pi ratio=3.19724 Making pie charts...done.
The main reason for the Raspberry Pi Zero 2 W appearing slower than the 3B and 3B+ is likely that it uses LPDDR2 memory instead of LPDDR3. 64-bit mode provides is a useful performance increase, offset by increased memory use. I found desktop apps to be almost unusably swappy in 64-bit mode, but there might be some tweaking I can do to avoid this.
Unlike the single core Raspberry Pi Zero, the Raspberry Pi Zero 2 W can be made to go into thermal throttling if you’re really, really determined. Like “3 or more cores running flat-out“-determined. In my testing, two cores at 100% (as you might get in emulation) won’t put it into thermal throttling, even in the snug official case closed up tight. More on this later.
(And a great big raspberry blown at Make, who leaked the Raspberry Pi Zero 2 W release a couple of days ago. Not classy.)

Consider the Adafruit PIR (motion) sensor (aka PIR Motion Sensor, if you’re in Canada). Simple, reliable device, but only runs from a 5 V supply. Yes, there are smaller PIRs that run off 3.3 V, but if this is what you have, you need to do some soldering. Annoyingly, the sensor on the board is a 3.3 V part, but the carrier was designed in Olden Tymes when King 5 V ruled.
You can try powering it from 3.3 V, but it’ll go all off on its own randomly as its own power supply won’t be supplying enough voltage. There are a couple of sites on how to modify these PIRs that either describe old kit you can’t get any more, or do it completely wrongly. Just one post on the Adafruit support forum gets it right.
One way of doing this is to provide 3.3 V directly to the output pin of the voltage regulator, and ignore the 5 V power line entirely. The regulator’s a SOT89-3 part that looks a bit like this:

In the photo above, it’s flipped over. Whichever way it’s oriented, we want to put power directly into the Vout pin. There may be easier points to solder this to than a tiny surface mount pin (almost definitely one of the capacitors) but this has held for me.
How to use it in MicroPython? Like the TTP223 capacitive touch sensors I looked at before, a PIR gives a simple off/on output, so you can use something like this:
from machine import Pin
from time import sleep_ms
pir = Pin(21, Pin.IN)
while True:
print("[", pir.value(), "]")
sleep_ms(1000)
value() will return 1 if there’s movement, 0 if not. There are trigger time and sensitivity potentiometers to fiddle with on the board if you need to tweak the output.

Just remember: don’t connect the 5 V power line if you make this mod. I’m not responsible for any smoke emitted if you do — but I can always sell you a replacement …
Notes
It’s very much a work in progress, but Geoff Graham and Peter Mather’s MMBasic runs nicely on the Raspberry Pi Pico. Development is mostly coordinated on TheBackShed.com forum.
It supports an impressive range of displays and peripherals. The project gives me a very distinct “This is how we do things” vibe, and it’s quite unlike any other Raspberry Pi Pico project.
To show you what MMBasic code looks like, here’s a little demo that uses one of those “Open Smart” LED traffic lights on physical pins 14-16 which cycles through the phases every few seconds:
' traffic light on gp10-12 (green, yellow, red), pins 14-16
' set up ports for output
FOR i=14 TO 16
SETPIN i, DOUT
PIN(i)=0
NEXT i
red=16
amber=15
green=14
DO
' green on for 5 seconds
PIN(red)=0
PIN(green)=1
PAUSE 5000
' amber on for 3 seconds
PIN(green)=0
PIN(amber)=1
PAUSE 3000
' red on for 5 seconds
PIN(amber)=0
PIN(red)=1
PAUSE 5000
LOOP
Result: 320×180, 22 frames, 128 colours, ~ 600 KB.

After a tonne of faffing about, I finally got something out of my plotter using Drawing Bot. I’d heard about it during the Bold Machines’ Intro to Pen Plotters course I’m taking, and the results that other people were getting looked encouraging. But for me, they weren’t great.
Maybe I was choosing too large images, but my main problem was ending up with plots with far too many lines: these would take days to plot. The controls on Drawing Bot also seemed limited: density and resolution seemed to be the only controls that do much. Drawing Bot itself wasn’t very reliable: it would sometimes go into “use all the cores!” mode when it was supposed to be idling. It would also sometimes zoom in on part of the image and fail to unzoom without quitting. Is a 32 GB i7 8-core (oldish, but still game) too little for this software? Forget any of the Voronoi plots if you want to see results today.
The source image was a geometric tile that I’d frisketed out years ago, forgotten about, and then found when I unstuck it from under a stack of papers. It’s somewhat artisanally coloured by me in watercolour, and the mistakes and huge water drop are all part of its charm:

If WordPress will allow an SVG, here’s what Drawing Bot made of it:
I do like the way that Drawing Bot seems to have ignored some colours, like the rose pink around the outside. The green border really is mostly cyan with a touch of black.
I haven’t magically found perfect CMYK pens in HP/Roland pen format. I couldn’t even find the Schwan-Stabilo Point 88 pens that Lauren Gardner at Bold Machines recommends. But the local DeSerres did deliver a selection of their own-brand 1.0mm Mateo Markers that are physically close to the Point 88s in size, but use a wider 1 mm fibre tip. They are also cheap; did I mention that?
The colours I chose were:
The RGB colours are from DeSerres’ website, and show that I’m not wildly off. Target process colours are the top row versus nominal pen colours on the bottom:

I knew to avoid pure black, as it would overpower everything in the plot.
To make the pens work with the DXY-1300, I modified juliendorra/3D-printable-plotter-adapters-for-pens-and-refills: Use your favorite pens with vintage HP plotters: parametric code to create custom adapters to work the the DeSerres pens. Here are my changed files, just in case my PR isn’t accepted:
Overall, it plotted quite well. I plotted directly from Inkscape, one layer/pen at a time, from light (yellow) to dark (grey). Using the pen 1 slot had its disadvantages: the DXY has little pen boots to stop the pens drying, but these unfortunately get filled with old ink. The scribbly dark markings in the NNE and SSW orange kites in the plot are from the yellow pen picking up old black ink from the pen boot. Next time I’ll clean the plotter better.

I’m remembering the time that Paul coloured a perfect square with a highlighter on their white family cat, Snowy. She had a pink side for weeks.
It’s hard to believe that Paul Carter has been gone fifteen years. Like all things digital, my ten year memorial for him was a bit dusty, so I did a re-encoding that will look better on today’s devices. The info page is unchanged.
Still miss you, buddy. It gets further but no easier.

This is a tiny detail from an unfeasibly large random walk made in Berkeley Logo. The code looks something like this:
; random dice walk, with colours for each of six directions
; scruss, 2021-07
make "ch {14 6 2 3 13 4}
make "dirs {0 60 120 180 240 300}
make "sides {1 2 3 4 5 6}
to walk
make "throw pick sides
setheading item :throw dirs
setpencolor item :throw ch
forward 20
end
hideturtle repeat 1000 [walk]