Instagram filter used: Lo-fi
Hey! This post is completely ancient. It doesn’t even use Python 3. Advice given here might be well out of date.
… it complains that the oscilloscope is always making waves.
Ahem. Anyway. I have a Rigol DS1102E 100 MHz Digital Oscilloscope. For such a cheap device, it’s remarkable that you can control it using USB Test & Measurement Class commands. I’d been wanting to use a Raspberry Pi as a headless data acquisition box with the oscilloscope for a while, but Raspbian doesn’t ship with the usbtmc kernel module. I thought I was stuck.
Alex Forencich turned up in the forum with an all-Python solution: Python USBTMC (source: alexforencich / python-usbtmc). I got this working quite nicely today on both the Raspberry Pi and my Ubuntu laptop. Here’s how I installed it:
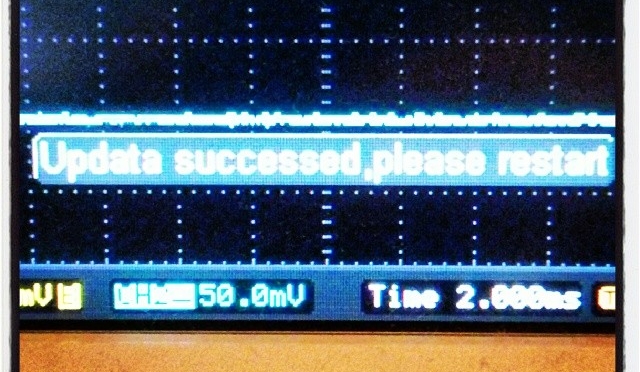
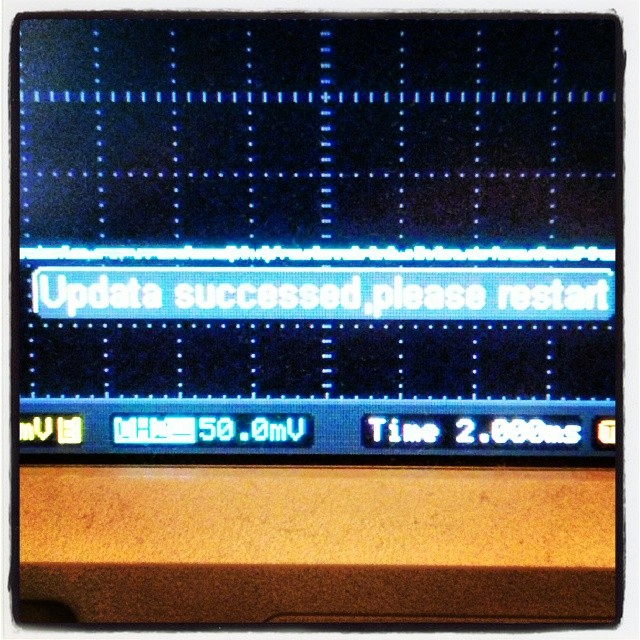
If you get the status line, congratulations! You now have a fully working usbtmc link. I haven’t had much time to play with this, but I know I can make really nice screenshots to an attached USB drive using the command: instr.write(“:HARDcopy”). Many more commands can be found in the DS1000D/E Programming Guide, available on Rigol‘s site.
I had a couple of problems, though:
I’ve still got to work my way through the Rigol’s data format, but other people have done that before:
I’ll post any updates here, along with the Raspberry Pi forum topic: USB Test & Measurement class (usbtmc) driver?
Incidentally, if you’re working with WFM data dumps from the Rigol ‘scopes (and you should, because they make storing data to USB drives quick), mabl/pyRigolWFM is basically magic. Not merely can it describe and decode those binary files, it can do pretty graphics with no thought required:
 Hat tip for the mention: MP3 Options & Oscilloscope Interfacing For Raspberry Pi @Raspberry_Pi #piday #raspberrypi « adafruit industries blog
Update, 2013-12-20: I’ve successfully managed to run most of Ken’s examples with Alex’s code. The major modification you have to do is use ask_raw instead of ask. Example code shown below:
#!/usr/bin/python
# -*- coding: utf-8 -*-

"""
Download data from a Rigol DS1102E oscilloscope and graph with matplotlib
         using  Alex Forencich's python-usbtmc pure python driver
                https://github.com/alexforencich/python-usbtmc
scruss - 2013-12-20

based on
Download data from a Rigol DS1052E oscilloscope and graph with matplotlib.
By Ken Shirriff, http://righto.com/rigol

which in turn was
Based on http://www.cibomahto.com/2010/04/controlling-a-rigol-oscilloscope-using-linux-and-python/
by Cibo Mahto.
"""

import usbtmc
import time
import numpy
import matplotlib.pyplot as plot

# initialise device
instr =  usbtmc.Instrument(0x1ab1, 0x0588) # Rigol DS1102E

# read data
instr.write(":STOP")
instr.write(":WAV:POIN:MODE RAW")
# first ten bytes are header, so skip
rawdata = instr.ask_raw(":WAV:DATA? CHAN1")[10:]
data_size = len(rawdata)

# get metadata
sample_rate = float(instr.ask_raw(':ACQ:SAMP?'))
timescale = float(instr.ask_raw(":TIM:SCAL?"))
timeoffset = float(instr.ask_raw(":TIM:OFFS?"))
voltscale = float(instr.ask_raw(':CHAN1:SCAL?'))
voltoffset = float(instr.ask_raw(":CHAN1:OFFS?"))

# show metadata
print "Data size:      ", data_size
print "Sample rate:    ", sample_rate
print "Time scale:     ", timescale
print "Time offset:    ", timeoffset
print "Voltage offset: ", voltoffset
print "Voltage scale:  ", voltscale

# convert data from (inverted) bytes to an array of scaled floats
# this magic from Matthew Mets
data = numpy.frombuffer(rawdata, 'B')
data = data * -1 + 255
data = (data - 130.0 - voltoffset/voltscale*25) / 25 * voltscale

# creat array of matching timestamps
time = numpy.linspace(timeoffset - 6 * timescale, timeoffset + 6 * timescale,
                      num=len(data))

# scale time series and label accordingly
if (time[-1] < 1e-3):
    time = time * 1e6
    tUnit = "µS"
elif (time[-1] < 1):
    time = time * 1e3
    tUnit = "mS"
else:
    tUnit = "S"

# Plot the data
plot.plot(time, data)
plot.title("Oscilloscope Channel 1")
plot.ylabel("Voltage (V)")
plot.xlabel("Time (" + tUnit + ")")
plot.xlim(time[0], time[-1])
plot.show()
Hi there! This post is beyond ancient, and made sense back when the original Raspberry Pi Linux distributions didn’t have floating point support. With the multi-core Raspberry Pi 3, lame now runs at an acceptable rate. You should probably ignore this post unless you’re deliberately trying to recreate that bubbly old MP3 sound.
One thing the Raspberry Pi is not good at is encoding MP3s at any great speed. At best (using lame) you might get slightly better than 2× real time playback. If you’re using your Raspberry Pi to transcode to another format, that might be slow enough (with other system overhead) to make the output stutter.
While it would be nice to have the GPU as a general media encoder, we’re not there yet. If you must encode mp3s quickly on a Raspberry Pi, there are a couple of options:
Please note that both of these are based on the old ‘8hz’ mp3 encoder, which was a fairly literal interpretation of the original Fraunhofer code. They only start producing okay sounding files at high bitrates.
If you need to decode mp3s quickly, MAD is pretty good: http://www.underbit.com/products/mad. It’s in the repos as ‘madplay’.
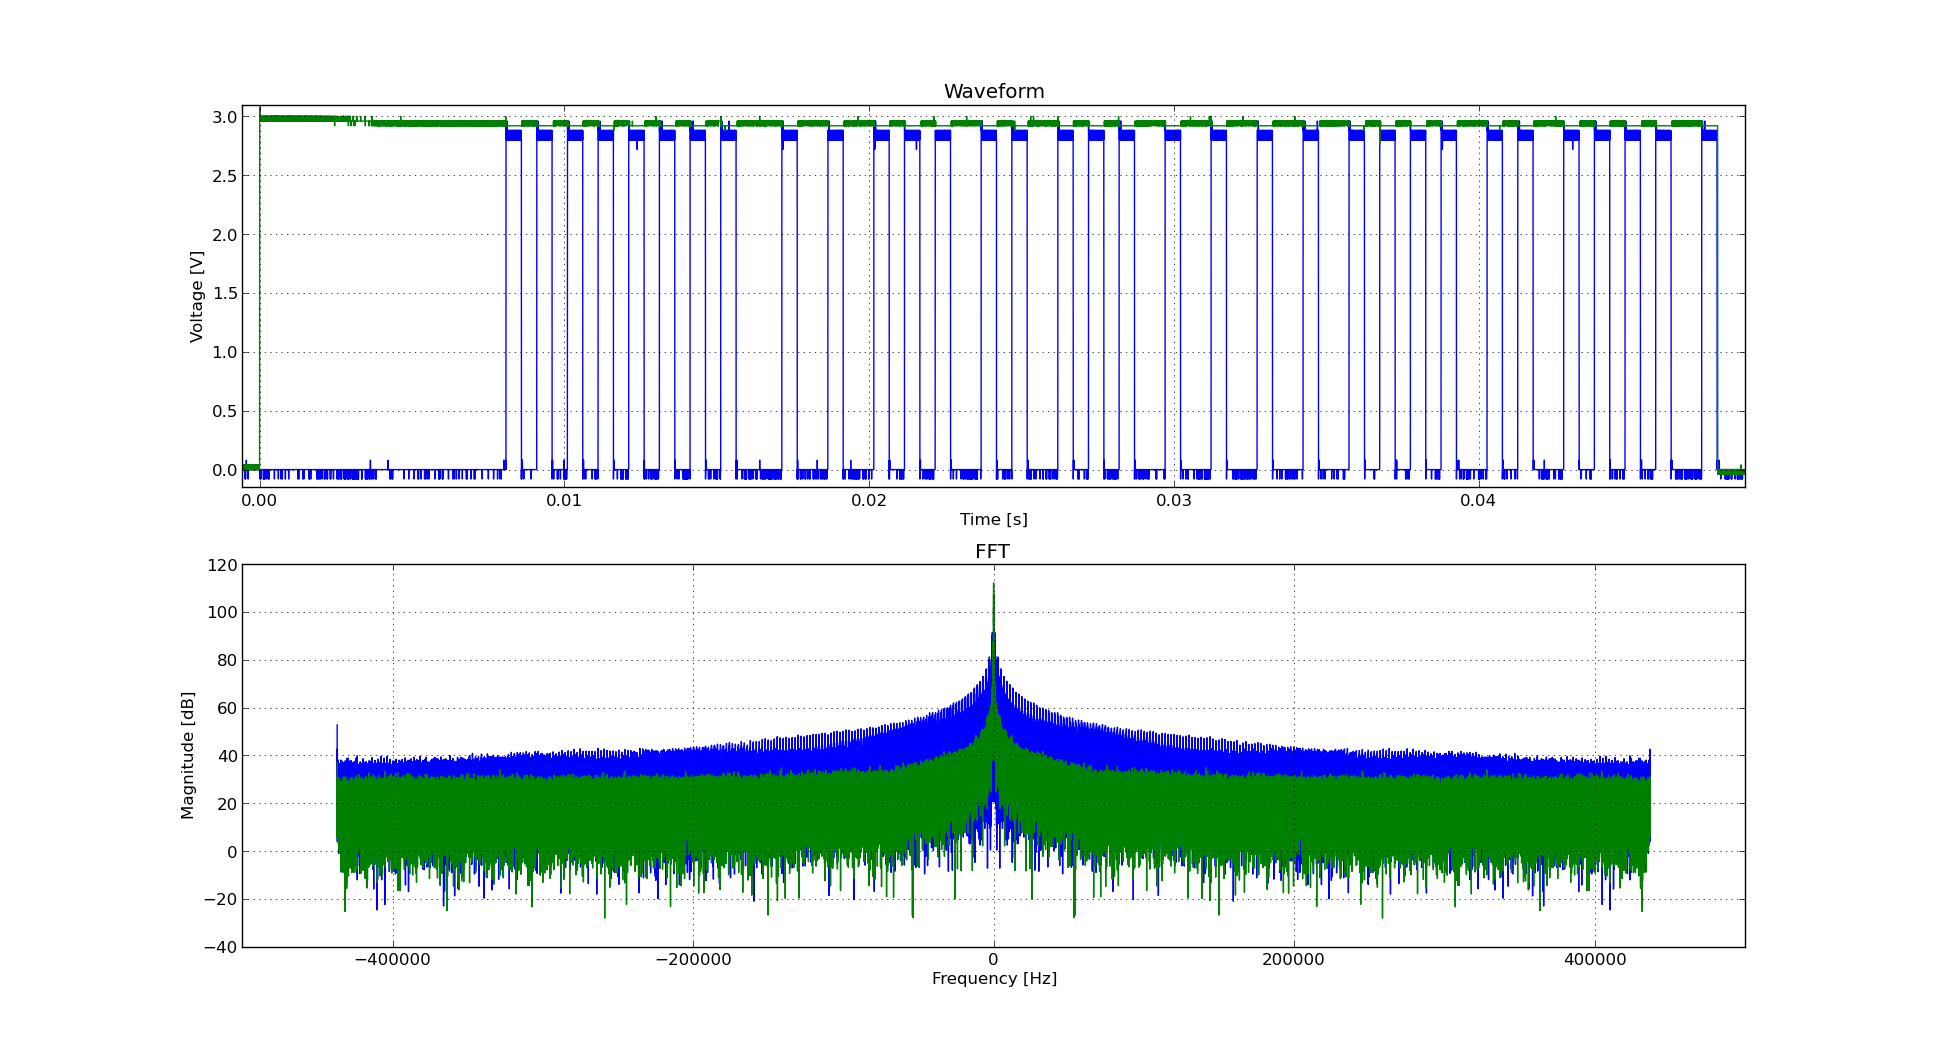
My JYE Tech miniDDS function generator has the fuzzies, alas. It seems that this is a known problem.
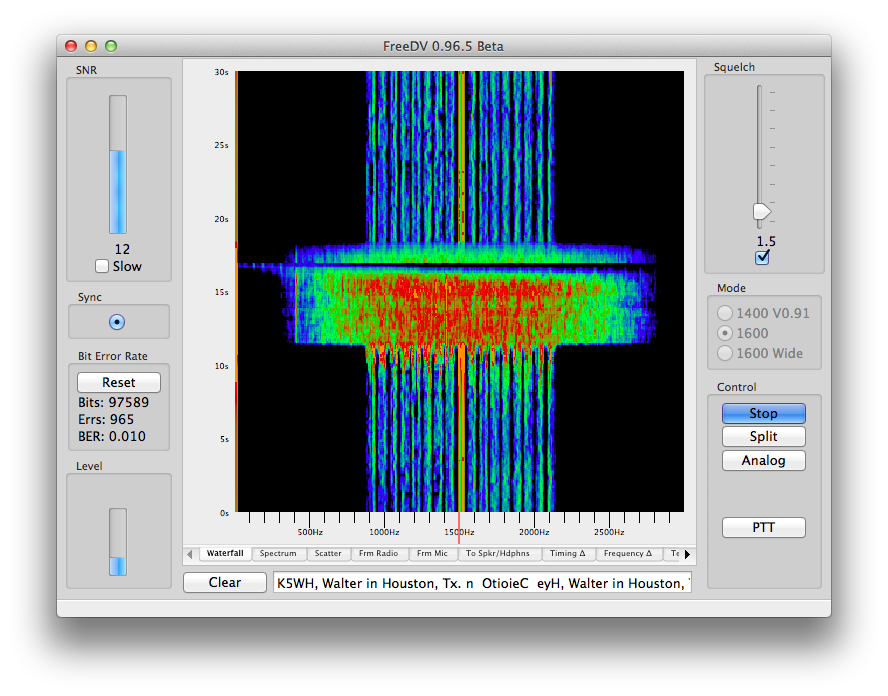 FreeDV is a fully open digital voice protocol; unlike DMR, D-STAR and the rest, there are no patents tying it down. It uses very little bandwidth for voice. I just had my first QSO (thanks K5WH in Texas!) using this mode. While it does make voices sound a little robotic, there’s no static, no hiss, nothing unwanted. That’s what always put me off HF voice: trying to work out who is saying what through all the noise. FreeDV fixes that.
It’s quite a new protocol, so you don’t hear it much on the air yet. I hope to be making some more noise with it soon.
Update 2014-10-02: I’ve forked Bryan’s Arduino code and added some instructions: scruss/Powermon433 (though use Bryan’s, srsly)
Update 2014-08-19: Bryan Mayland has decoded the data on Arduino! More details here: CapnBry/Powermon433
Given that I first started thinking about reverse-engineering the Blueline Powercost Monitor‘s data stream in September 2010, I hardly win any awards for rapid development. Here’s what I know so far about the device and its transmissions:


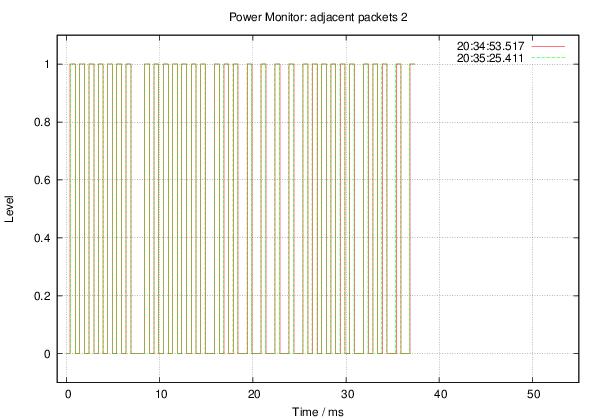
Some rough notes on mark/space timing (all times in µs):
Mark : Mean    529.4 Min    499.0 Max    590.0 StdDev:   15.03
Space: Mean    694.5 Min    385.0 Max   1474.0 StdDev:  281.57
Mark/space times, by frequency (all times in µs):
MARK
====

          µS
Rank     Value   Count
-------- ------- -----
     1         522  498
     2         544  206
     3         567   32
     4         499   32
     5         590    8

SPACE
=====

          µS
Rank     Value   Count
-------- ------- -----
     1         476  279
     2         975  223
     3         454   99
     4         952   65
     5         431   26
     6        1474   22
     7         408   21
     8         499   17
     9         998   12
    10      199000    8
    11         385    2
    12        1451    2
More later, including raw packet data.
Thanks to Randy Simons and Bryan Mayland for the recent help. Thanks too to Brett “Wiring†Hagman for asking just why I was trying to do this …
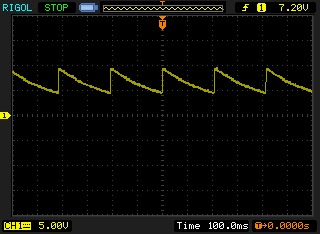
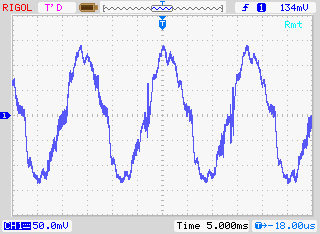
I’m pretty sure the 9V DC power supply for one of my Roku Soundbridges shouldn’t be doing that ↑↑ . This is the second unit I’ve had to replace, my other Soundbridge blowing its 5 V supply a couple of years back. This one cycles from 9.4 to 4.4 V about 5 times a second. Not very DC, but kind of lethargic for AC.
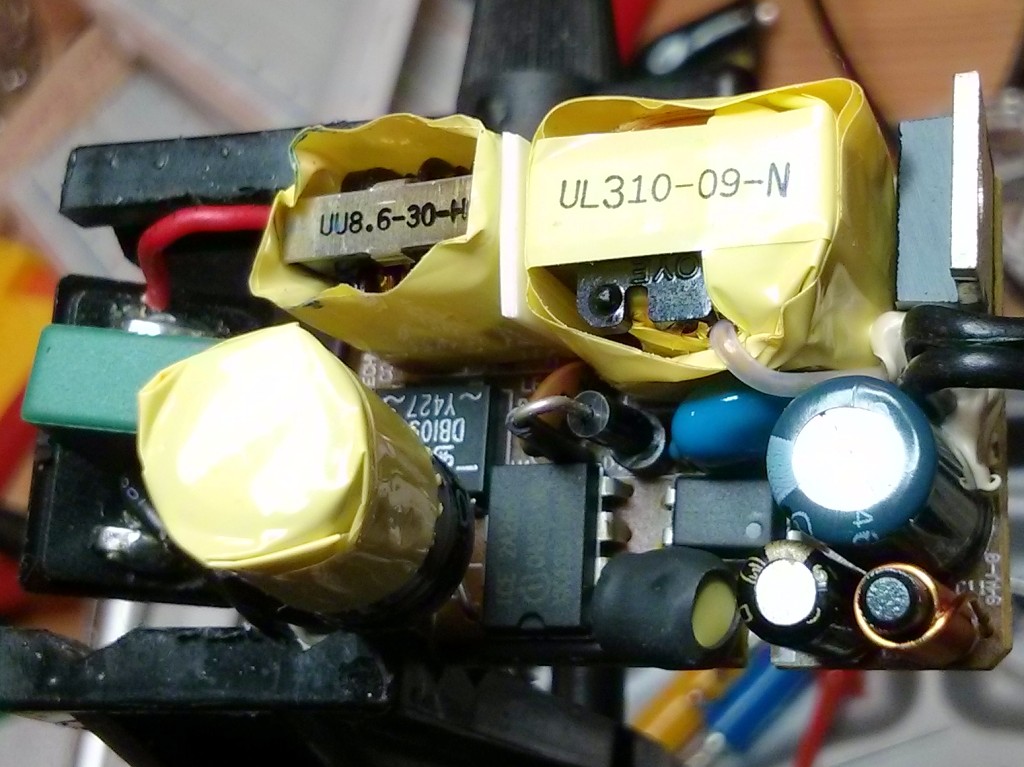
It’s hard to tell, but one of the caps inside the rather complex little Unifive wall wart may have blown. I’ve scrapped the PSU and replaced it with a beefier one. It seems that power supplies are a problem (see: 1, 2, 3, 4) on these machines, so I wonder when/if I will need to replace this one.