My previous adventures with my Sinclair ZX Spectrum 48K in Canada were not resounding successes. I couldn’t get the display to work, and tapes wouldn’t load well, so I’d been using Fuse while the hardware sulked in a cupboard.
I’d previously got a proper power supply (9 V DC, ≥ 1.4 A, centre negative) and bypassed the PAL UHF modulator to give composite video. No television, monitor or converter box that I had tried seemed to give a useful display.
Back in May, Walter Miraglia brought a tiny 7″ composite colour monitor to TPUG‘s Retrocomputing Night. He let me try it with the Spectrum, and it worked very well. Walter said it was an extension monitor for a car DVD player.
I dug around, and found that local surplus clearout store Tech Source Canada had the Philips 7″ portable DVD Player PD7016/37 for $60. This gives you two identical DVD players with composite input. I think my other one will be destined for a Raspberry Pi project somewhere.
To get these monitors running, you’ll need:
- a 9–12 V DC power supply able to give ≥ 1 A. I use a regulated supply that gives 9.1 V open circuit and is rated at 2 A. Note that the power connector is slightly smaller than the common 2.1 mm barrel, so you may have to order this one, unless you can solder something up.
- A cable like this 3.5mm Stereo to Composite Video + Audio Cable (3 RCA). These are sometimes just called camcorder cables. They use a 3½ mm TRRS jack, and can also — if you don’t mind not quite having the connectors in the right order — work with the composite/audio output of more recent Raspberry Pis. Tech Source had these for under $5.
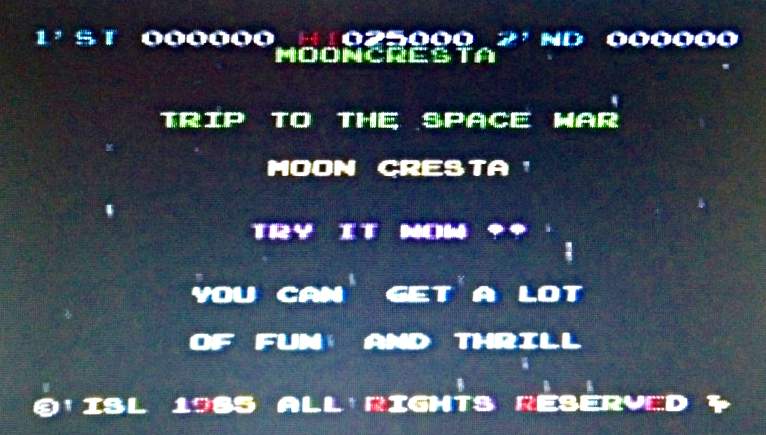
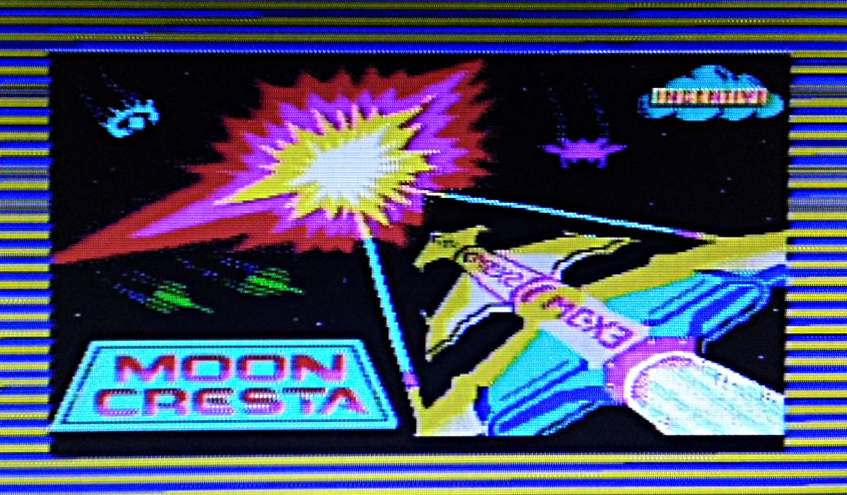
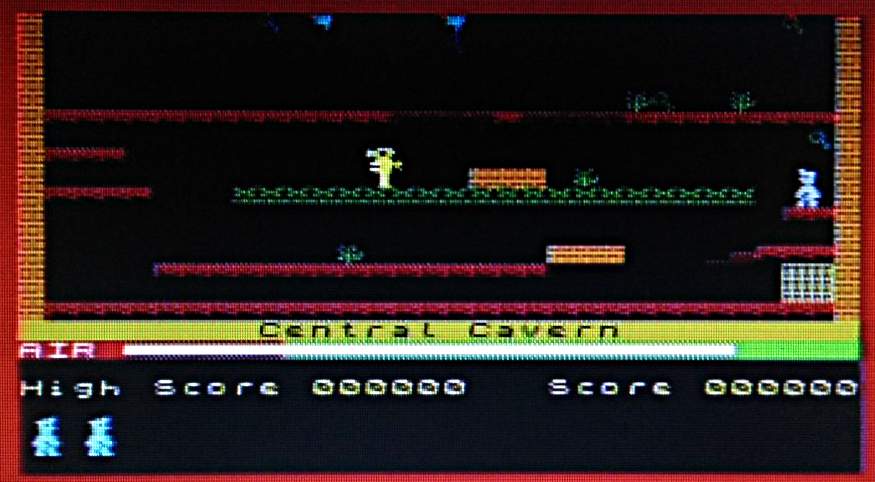
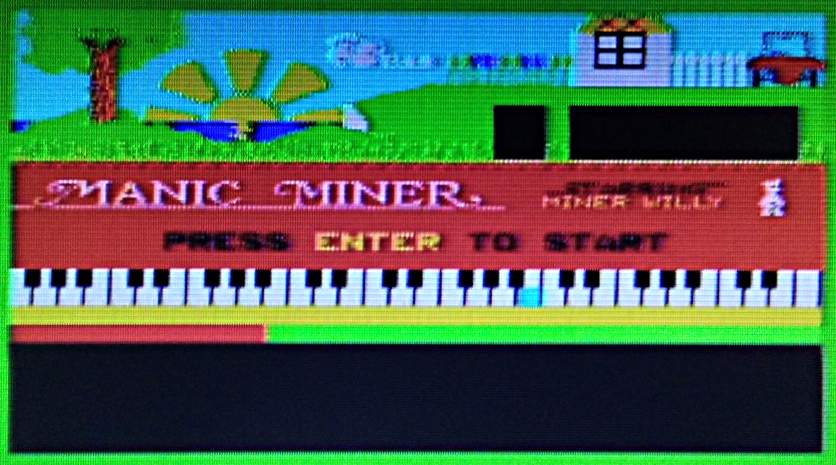
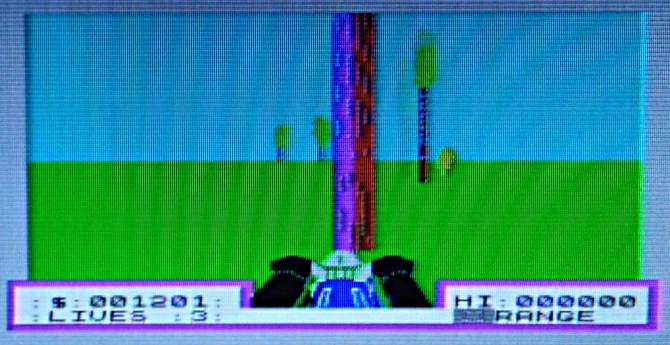
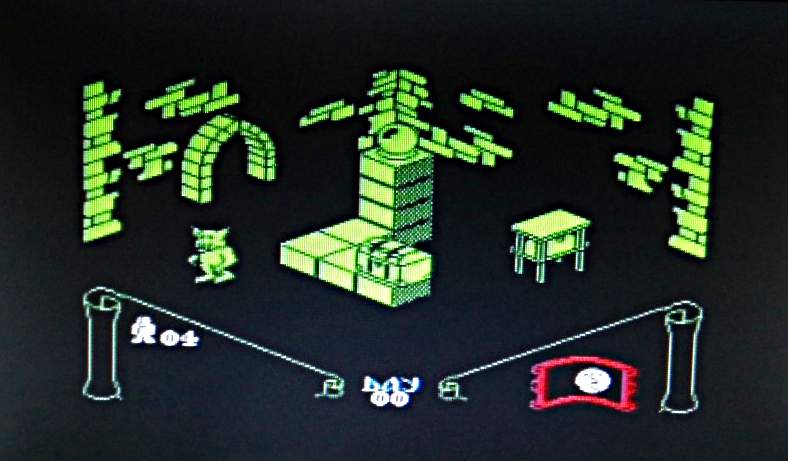
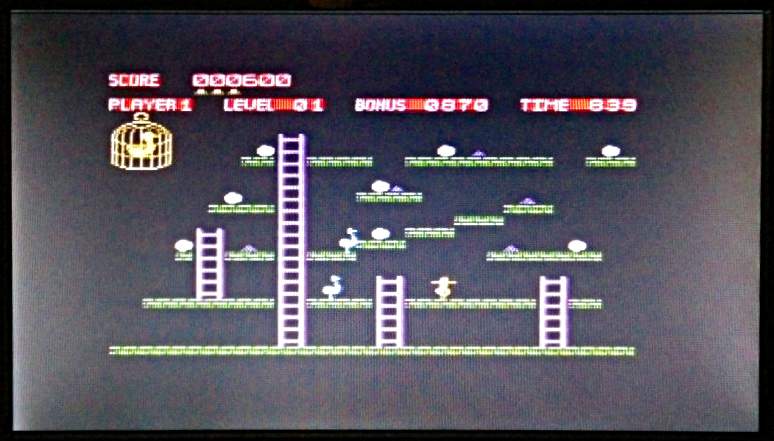
Connect it up , and — success! Well, slightly qualified success. The screens do not have the greatest resolution, so pixels are slightly smeared together. The screens do have a decently fast refresh, and the whole look is just right. With its colour clash and dot crawl, nobody ever expected great video from the Speccy anyway.
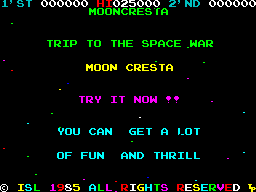
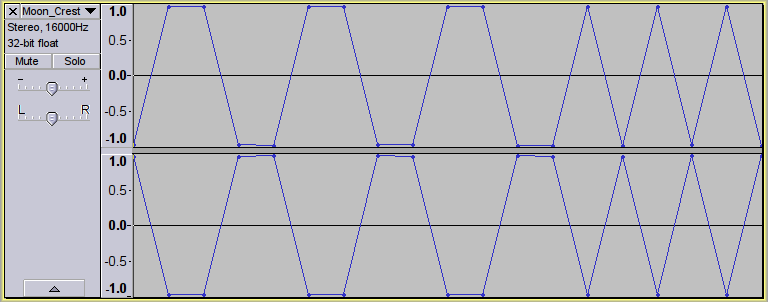
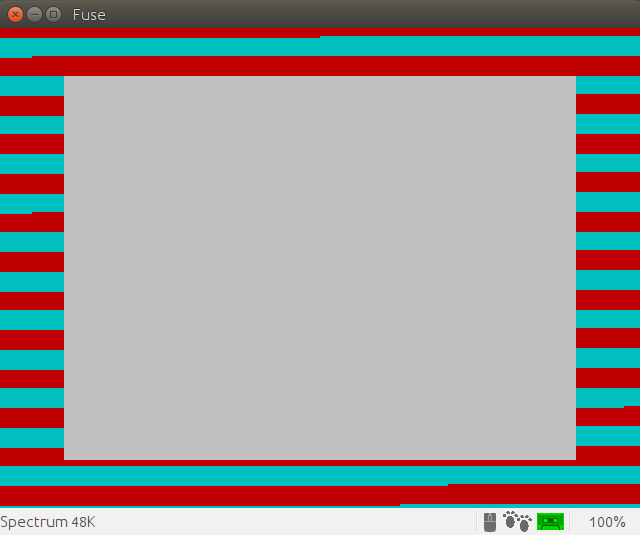
Here are some screen shots taken with my phone, and a couple of pixel-sharp screenshots from Fuse to compare:

So I can now definitely view the screens. Huge thanks to Walter for tipping me off to these DVD players.
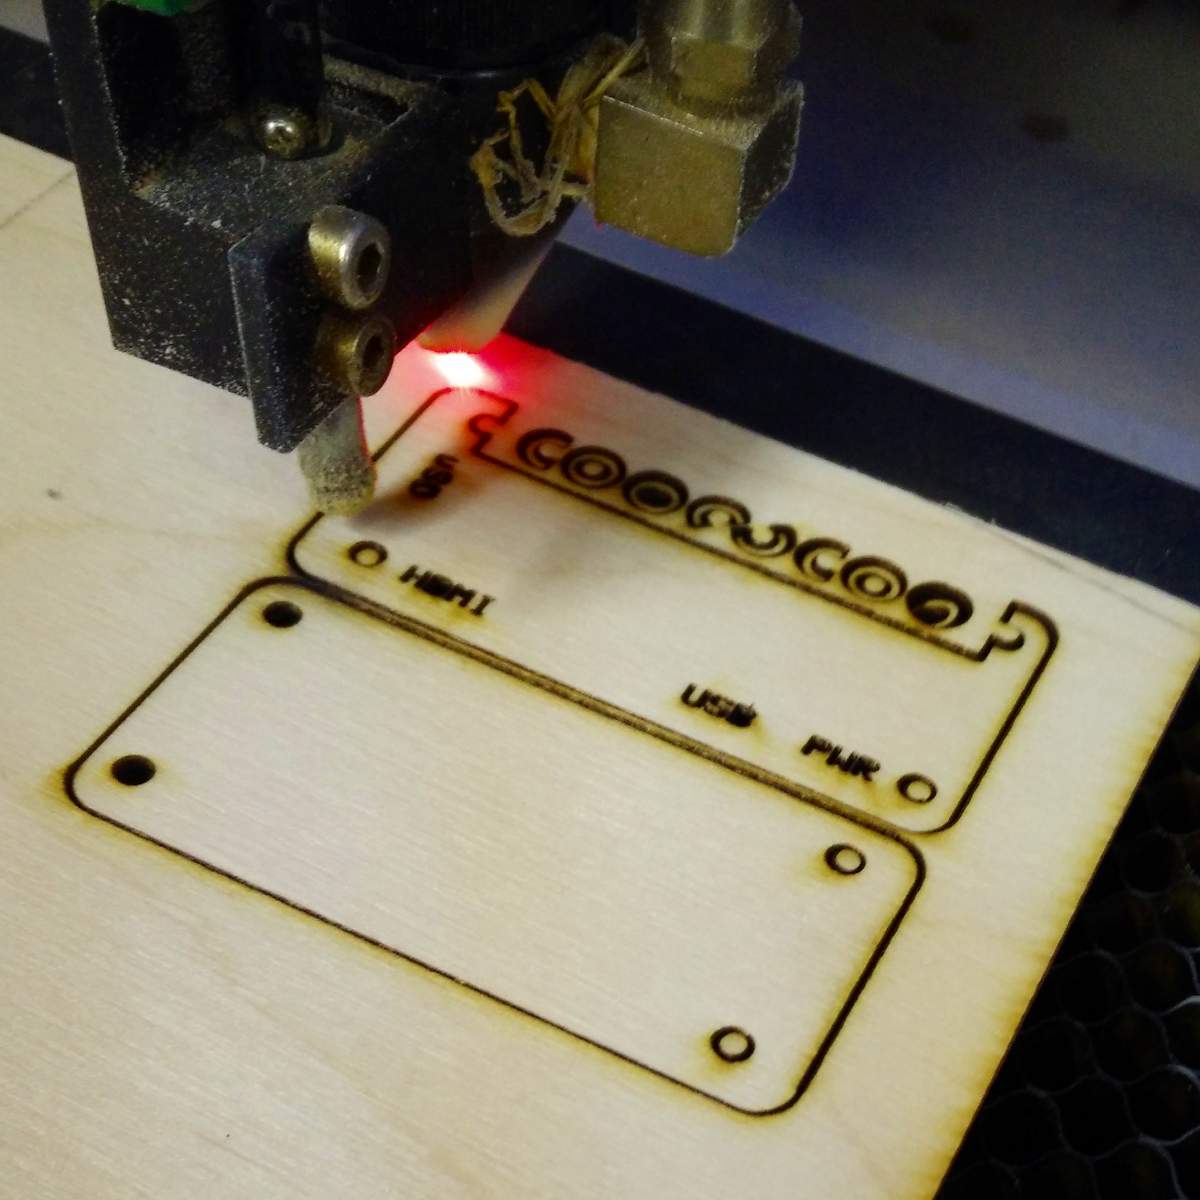
[Incidentally, the screens are designed for car use, so don’t stand up properly unless you get creative with some supports. I laser-cut these out of 3 mm plywood:

Glue the little sticks on to the flat ends, and they’ll fit into the slots in the back of the monitor. Here are the feet with the sticks fitted:
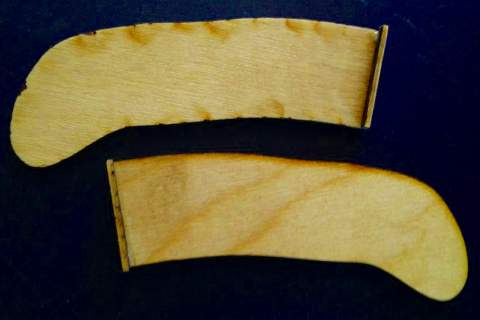
There are better-designed feet than these, but they work, mostly.]
I was still having game loading problems. Try as I might, I couldn’t get anything to load reliably. Retrocomputing Stack Exchange came to the rescue, in the shape of mcleod_ideafix’s very helpful answer. If your audio player is running from batteries and you can use a stereo cable, you can convert the normal mono loading audio into stereo with one channel inverted. This gives you effectively double the volume, and works quite well with my audio player, an old Edirol R-1*.
This audio will not load into an emulator, or work with a mono cable. Some audio players even render it as silence.
Here’s a script to take monophonic loading data and convert it to this faux-differential stereo format using Sox:
#!/bin/bash
# wav2differential.sh - convert mono game tape audio to 2× stereo
# usage:   wav2differential.sh infile.wav
#          (creates  infile-differential.wav)
# scruss - 2016-06-07
# method by ‘mcleod_ideafix’; many thanks / greetz
#   — https://retrocomputing.stackexchange.com/a/774/439

base="${1%.wav}"
sox -q --norm=-3 "$1" -b 16 "${base}-n.wav"
sox -q  "${base}-n.wav" "${base}-ni.wav" vol -1.0
sox -q  --norm=-0.1 -M -c 1 "${base}-n.wav" -c 1 "${base}-ni.wav" -c 2 -b 8 "${base}-differential.wav"
rm -f  "${base}-n.wav" "${base}-ni.wav"
If you want to check your audio levels, sox can also create the 800 Hz header tone used by the Spectrum. Run the output of the command below through the script above, load it onto your audio player and fiddle with the volume until the border flickers steadily:
sox -n -b 8 -r 8000 800hz-header.wav synth 30 square 800
I was also looking for the games to load fairly quickly. Tapes used to take over three minutes to load, and while retrogaming all is about the experience, I haven’t got time for that. Fuse has some utility programs which will convert a .Z80 game snapshot into an audio file that loads in about 1¼ minutes.
To convert the snapshot to a speed-load TZX tape image:
snap2tzx -o game.tzx -s 3 game.z80
To convert that virtual tape image into audio:
tape2wav -r 16000 game.tzx game.wav
You can then run that WAV file through the stereo/differential script I listed above. Have fun!