I have always meant to do more with the idea of Re-creating RAND’s ‘A Million Random Digits’ but it’s a lot of effort for very little return.
This week, however, I had a chance to be my own random number generator. A routine medical investigation had me get a couple of shots of CardioLite®, a tracer chock-full of the radioisotope 99mTc. This has a half-life of just over six hours, and meant I was furiously (if harmlessly) radioactive for a couple of days.
My trusty MightyOhm Geiger Counter got some use:
(The truly ghoulish amongst you might clock the date code on the Soviet-era СБМ20 tube: 03–87. Now, I wonder why people would be busy making these things in 1987 …?)
The first measurement I made, a little more than four hours after my second shot of CardioLite®, was over 75000 counts/minute. As I write this, more than two days later, I’m barely registering over background level. I’m kicking myself (gently) for not thinking of rigging up this random number generator earlier, but hey: next time …
I don’t remember where I heard of this method — possibly the late John Walker’s HotBits server — but random bits from radioactive decay can be found by:
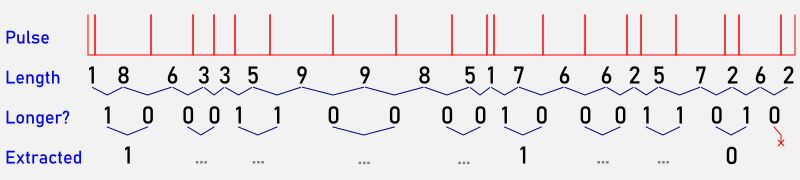
- recording the time intervals between counts;
- If the previous interval is shorter than the most recent one, record 1. Otherwise, record 0;
- Compare pairs of bits:
- If they’re the same, discard them;
- If they’re different, record the first one.
That last step is a von Neumann Randomness extractor. While it consumes three quarters of the bit stream, it does clear up trivial glitches and stuck bits in the data. What it can’t help with is removing any inherent bias in the data. This won’t be a problem with background radiation, or with radioisotopes with a long half-life. Unfortunately 99mTc decays quite rapidly.
So here’s roughly 5:50 of background plus my own personal radiation recorded a day and a bit after getting the CardioLite™ shot:
It’s a simple CSV file with two columns: a timestamp in microseconds, and a 1 indicating a pulse. I stripped out the 0 lines as they added nothing but bulk. The average rate over the whole file is about 2000 counts/minute, a fraction of the initial value.
You can convert these pulses into a format stream of decimal digits using this script:
#!/usr/bin/env bash
awk -F, 'NR>2 && $2==1 {print $1-p;} $2==1 {p=$1}' \
    GeigerCounter-20260627125000-1s.csv |\
    awk 'NR>1 {print ($1>p)?"1":"0";} {p=$1}' |\
    paste - - |\
    awk '(NF==2 && $1 != $2) {print $1;}' |\
    paste - - - - |\
    tr -d '\t' |\
    awk 'length($0)==4' |\
    while
	read n
    do
	echo "$((2#$n))"
    done |\
    awk '($1<10) {print $1;}' |\
    paste - - - - - |\
    awk 'NF==5' |\
    tr -d '\t' |\
    column -x
Which produces this delightful 10-column output, just like in the book. Unfortunately, WordPress being WordPress, I have to reformat it in five columns to fit:
24706 01995 88339 56253 13590
94840 27561 44882 00438 83191
44908 62879 31700 77035 77580
24259 25028 90295 80177 44425
77840 91877 01808 40411 78604
80671 11095 77770 73361 82022
72607 21941 22774 00291 15946
82318 23265 73230 92052 08205
87500 77977 04715 63782 23096
78036 62051 26806 04072 45339
84834 18079 09151 21061 72237
86391 55872 96535 39211 60718
69699 70154 96182 34330 37190
37806 79871 07121 62693 84271
24814 61766 25520 00808 31585
22257 79958 70119 78071 81958
90107 15800 03198 90890 32005
13587 49799 03401 66460 47582
02219 33431 77975 64865 87830
02630 17461 57396 47819 94379
28581 75002 32609 24884 38612
33844 63903 26378 72561 91464
97679 35768 39138 31780 19588
48088 60300 97267 84375 64982
88364 69709 57600 44108 08439
53293 85045
Are these digits truly random? There are too few to tell. There may be some bias due to the isotope that was in me having a short half-life: the first minute’s data contains 2153 counts, while the last minute only has 2077. Whether this is due to natural variations in background radiation, I can’t tell.