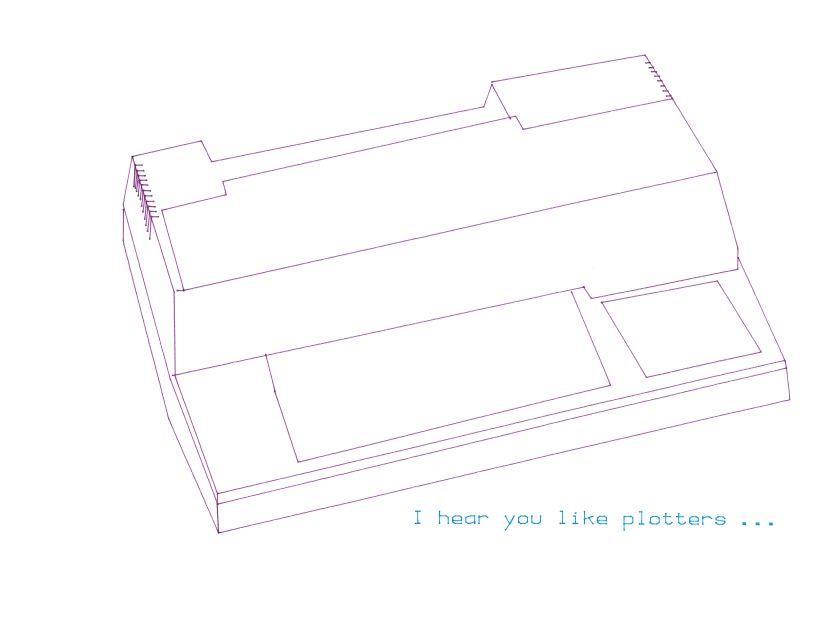
That Brother laser printer you bought can also pretend it’s a plotter. One of the requirements embedded in a PCL-compatible printer is an implementation of HP-GL/2. This is a slightly modified version of the page description language used by HP’s pen plotters. With care, you can make proofs on a laser printer.
But add some magic header bytes (0x1b, 0x45, 0x1b, 0x25, 0x30, 0x42) and some trailer bytes (0x1b, 0x25, 0x30, 0x41, 0x1b, 0x45), and your printer understands it’s a PCL file.
The file, complete with header and trailer, is here:
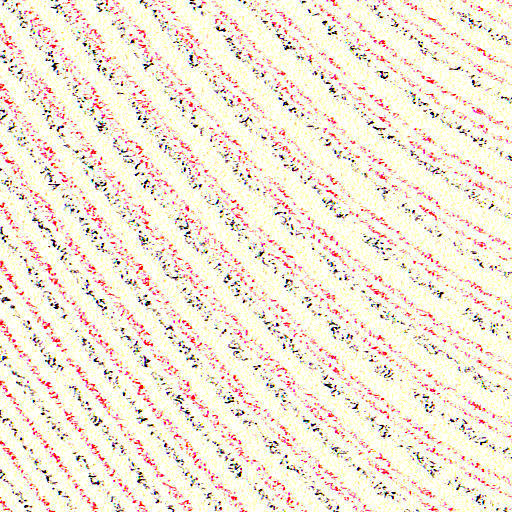
full page scan of that HP-GL file as printed on a Brother MFC-L2750DW
HP-GL/2, on mono lasers at least, has some differences to the version used on plotters. The biggest difference is that there’s just one pen. You can change the pattern and line attributes of this pen, but you don’t get to change to multiple pens with different colours.
Pen plotters were pretty expensive and complex pieces of electromechanical equipment. While they often earned their keep in the CAD office, they also had a function that’s almost forgotten: they could be used as input devices, too.
As a kid, we sometimes used to drive past the office of Ferranti-Cetec in Edinburgh. They specialized in digitizers: great big desk or wall mounted devices for capturing points from maps and drawings. Here’s one of their 1973 models:
While the technology and size have changed a bit, these huge bits of engineering kit are the ancestors of today’s track pads and touch screens.
Realizing that their plotters had very precise X-Y indexing and that they had two-way communications to a computer, HP made a drafting sight that fitted in place of a pen on their plotters:
HP drafting sight, part no 09872-60066.
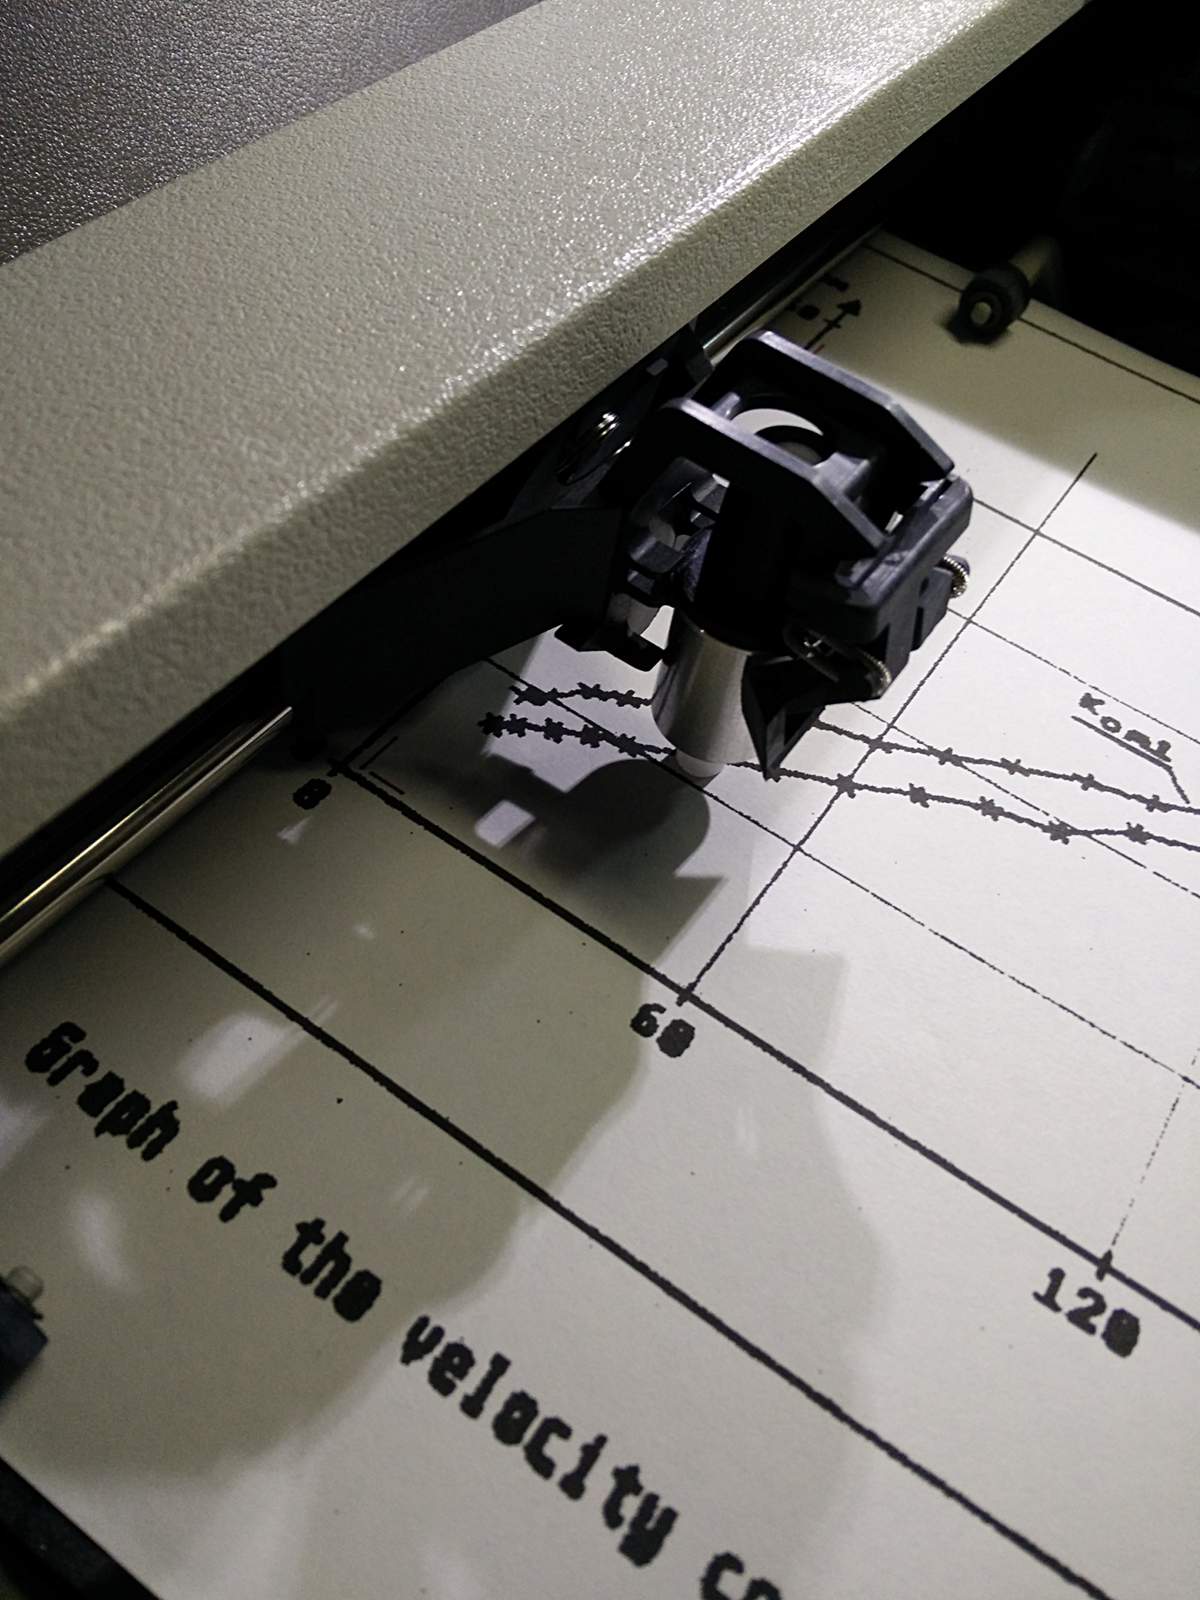
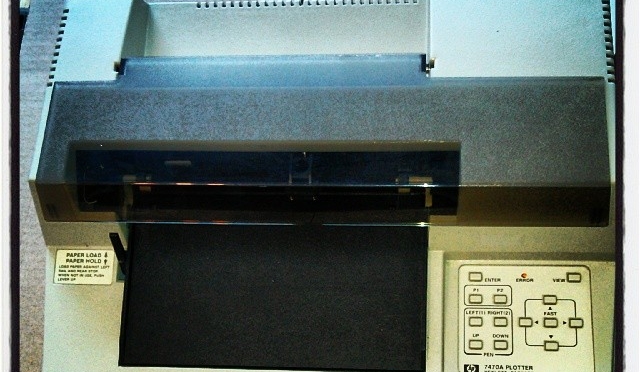
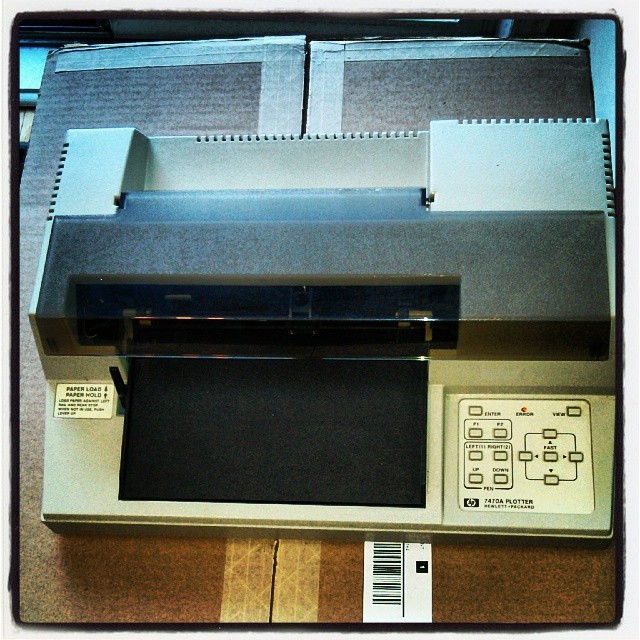
This is a very pleasing piece of kit, all metal, thick plastic and polished optical glass. They show up on eBay occasionally, and aren’t cheap. With a bit of coercion, it fits into my HP plotter like this:
Drafting sight in HP7470A plotter
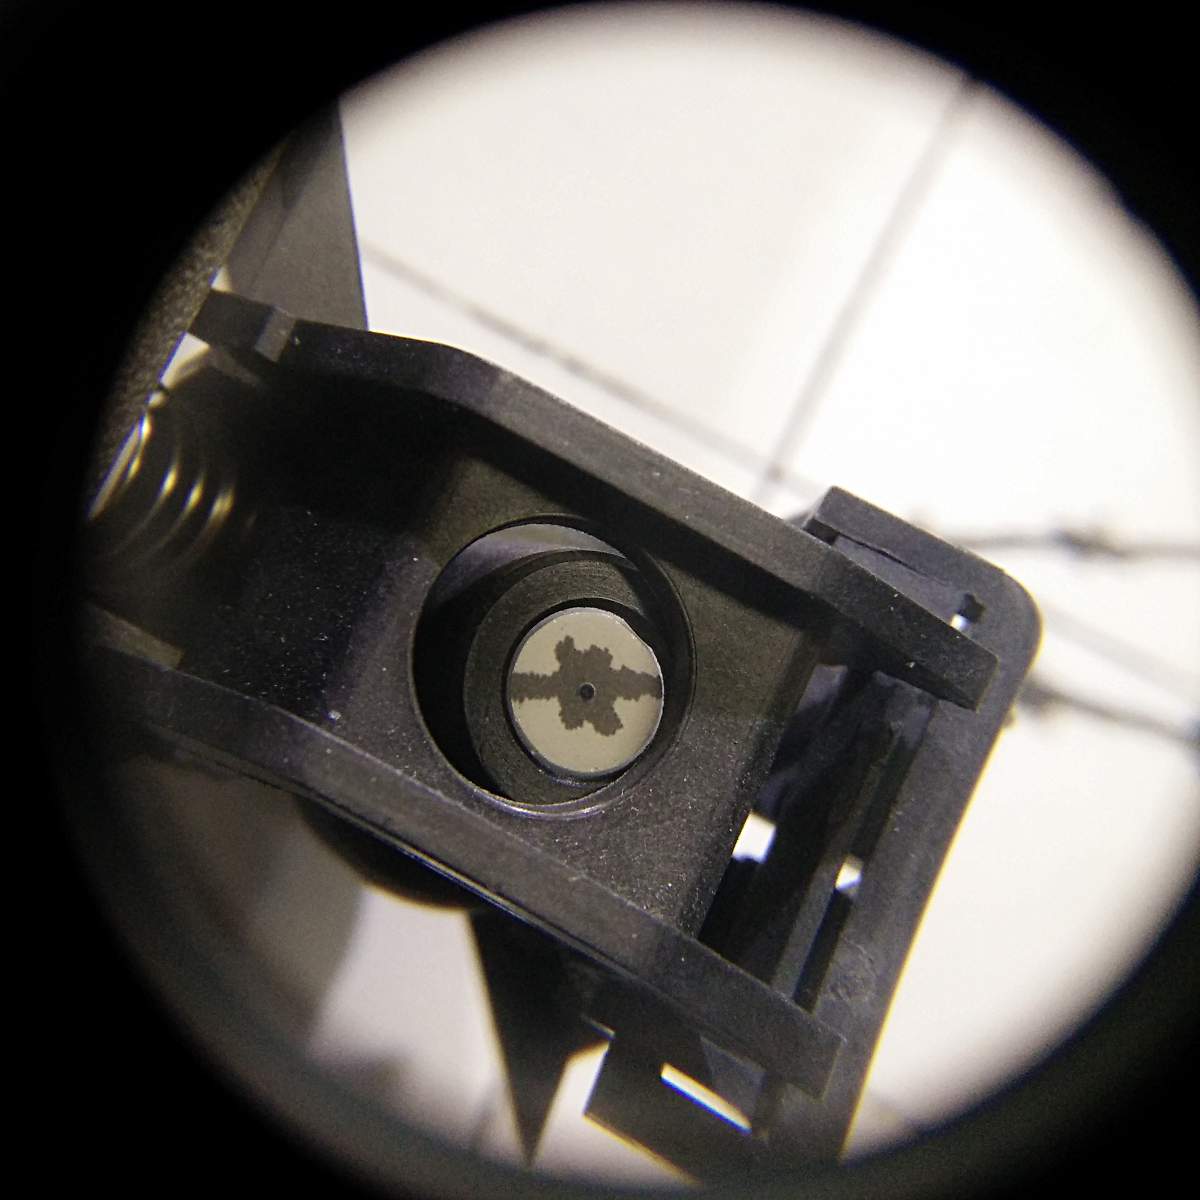
The image is very bright and clear:
Drafting sight near an axis labelDrafting sight over a point, showing cursor dot
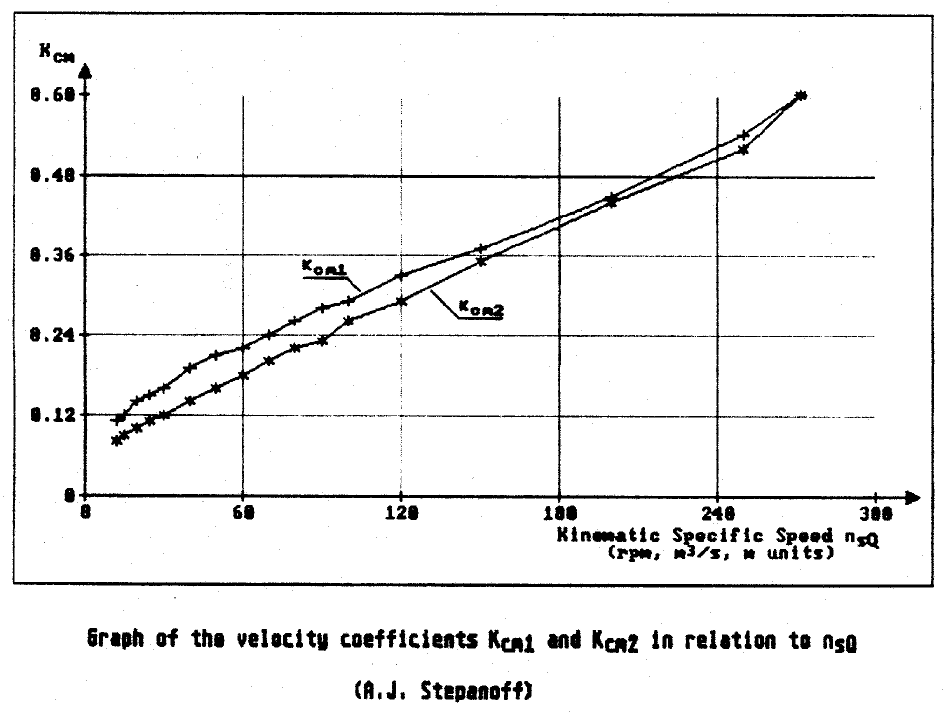
If one has a digitizing sight, one needs to find something to digitize post haste. I’m sure everyone can sense the urgency in that. So I found this, a scan from my undergraduate project writeup (centrifugal pump impeller design ftw, or something), which was probably made on an Amiga or Atari ST:
It’s a graph, with pointy bits on it
I printed this as large as I could on Letter paper, as it’s the only size my HP7470A plotter can take. Now all it needed was a small matter of programming to get the data from the plotter. Here’s a minimally-useful digitizer for HP and compatible serial plotters. Although I ran it on my little HP grit wheel plotter attached to a Raspberry Pi, I developed it with my larger Roland plotter. The only fancy module it needs is pySerial.
#!/usr/bin/env python
# -*- coding: utf-8 -*-
# a really crap HP-GL point digitizer
#  scruss - 2016

from time import sleep
from string import strip
import serial

ser = serial.Serial(port='/dev/ttyUSB1', baudrate=9600, timeout=0.5)
lbl = ''
points = []
labels = []
k = 0
retval = 0

ser.write('DP;')                # put in digitizing mode
while lbl != 'quit':
    ser.write('OS;')
    ret = strip(ser.read(size=5), chr(13))
    print ('Retval: ', ret)
    if ret != '':
        retval = int(ret)
    if retval & 4:              # bit 2 is set; we have a point!
        print ('Have Point! Retval: ', retval)
        retval = 0
        ser.write('OD;')
        pt = strip(ser.read(size=20), chr(13))
        print ('OD point: ', pt)
        lbl = raw_input('Input label [quit to end]: ')
        points.append(pt)
        labels.append(lbl)
        k = k + 1
        ser.write('DP;')        # put in digitizing mode again
    sleep(1)
ser.close()

f = open('digit.dat', 'w')
for i in range(k):
    f.write(points[i])
    f.write(',')
    f.write(labels[i])
    f.write('\n')
f.close()
In the unlikely event that anyone actually uses this, they’ll need to change the serial port details near the top of the program.
The program works like this:
Move the drafting sight to the point you want to capture using the plotter’s cursor keys, and hit the plotter’s ENTER key
Your computer will prompt you for a label. This can be anything exceptquit, that ends the program
When you have digitized all the points you want and entered quit as the last label, the program writes the points to the file digit.dat
I didn’t implement any flow control or other buffer management, so it can crash in a variety of hilarious ways. I did manage to get it to work on the lower trace of that graph, and got these data:
The first two columns are X and Y, in HP-GL units — that’s 1/40 mm, or 1/1016 inches. The third column will always be 1 if you have the sight down. The last columns are the label; if you put commas in them, opening the file as CSV will split the label into columns. I used it to fudge axis points. You’ll also note that the last three lines of data are my valiant attempts to quit the program.
Assuming the axes are not skewed (they are, very slightly, but shhh) some simple linear interpolation gives you the results below:
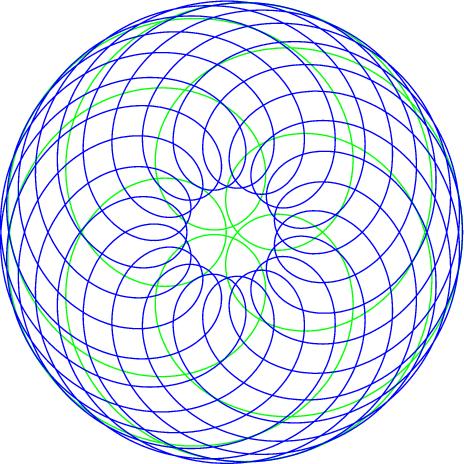
(For prettier things to do with plotter digitizing commands, Ed Nisley KE4ZNU has made some rather lovely Superformula patterns)
If you don’t have a plotter, or even if you do and you don’t have hours to waste mucking about with Python, obsolete optics and serial connections, Ankit Rohatgi’s excellent WebPlotDigitizer (or Engauge, as I found out when this article hit HackerNews in 2021) gets numbers out of graphs quickly. It handles all sorts of graphs rather well.
Update, 2025: eek, but WebPlotDigitizer is now login-only and has been infested by AI shite. Run away now, run away fast … or try to find an old mirror online, such as WebPlotDigitizer at utk.edu.
If you’re running an old plotter, getting pens can be a worry. While there are some companies that might still make them (Graphic Controls/DIA-Nielsen, for one) they are expensive and limited in range. They’re also felt-tip, which means they’ll dry out if not carefully re-capped.
While eBay might supply all things (like these Roland DG plotter pens I scored a couple of days back; fine, black, new old-stock, or these German plotter pens), I also found this:
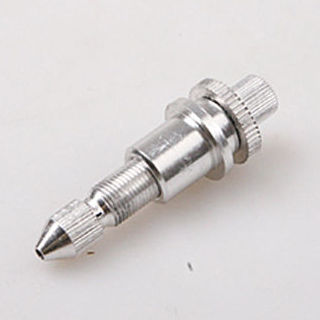
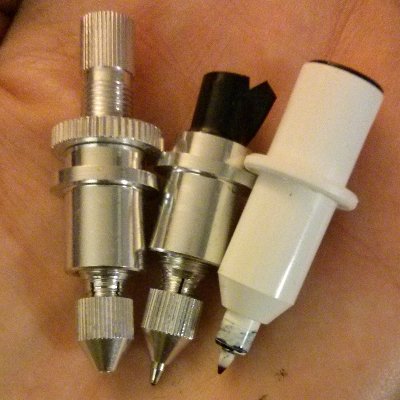
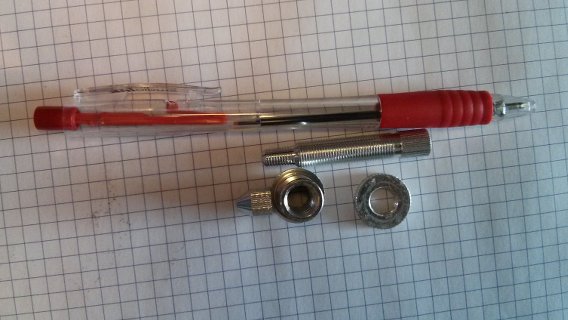
The one on the left is an unmodified pen holder. Well, it’s really a ballpoint-refill holder, as it comes with a (random colour of blue) refill. To modify these to fit into an HP desktop plotter, you will need to:
Cut ~10 mm from the end of the holder. A Dremel + cutting disk is a satisfying way of doing this. The gap between the knurled bit and the thread seems to be a decent place. Clean up the sharp edges
As the knurled lock ring will stop the pen engaging in the carriage (my HP-7470A does a lovely little hesitant try… nope; try… nope; try… give up sequence), you’ll have to do without it. Find another way of jamming the threads of the threaded collar in the right place. I used electrical tape, and it’s held so far. Wiser users will use different colours of electrical tape for different pens, ahem …
Stick the pen refill in and tighten down the collet lightly with pliers. ¡¡¡ Do not try to pull the refill out while it is in the collet !!! (The ballpoint insert will likely pop out, and viscous ink will start to blort out everywhere. Ask me how I know!)
Snip the end of the refill flush with the end of the pen holder using diagonal cutters. Best to do this directly over a rubbish bin, as pen ink is nasty. Dab off excess ink from the end of the refill, and clean your cutters, too.
The base of the threaded collar should be around 29 mm from the pen tip, otherwise nothing will plot (if it’s too short) or you’ll poke holes in the paper (if too long). This measurement doesn’t seem to be extremely critical: my Roland pens have it at 28.5 mm, the DIA-Nielsen pens are 28.9 mm. One of my homebrew pens is working at 30½ mm, but then, my basic plotter has no force control, so it may be more forgiving than more elegant beasts.
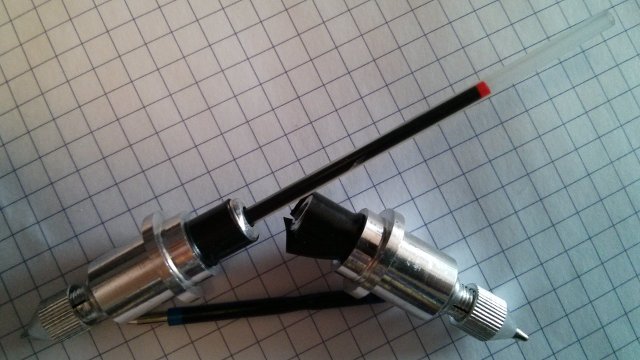
My modified pens look like the above.
The dollar store is a good source of cheap ballpoint pens. I managed to snag 8 retractable red pens for $1.25, and 4 black pens for $1.
(These retractable pens more often than not eject the whole internals across the room when you retract ’em.)
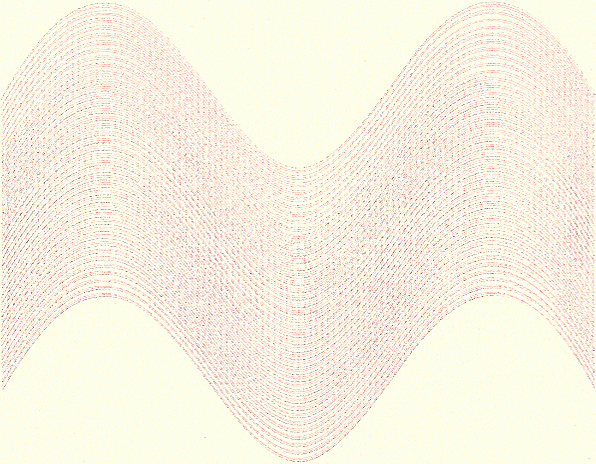
It’s probably a good idea to scribble with the pens a bit before and after modifying them, as they take a while to flow freely. They plot very lightly; the black ink looks more like a faint pencil line.
The lines — which should be a constant(ish) distance apart, if the paper has stayed in registration — are showing a varying distance from each other. It looks like the pen points are a little off-centre, so when the pen is swapped out, it gets turned to a slightly different position. This would really only matter for precise work, and I find the effect interesting.
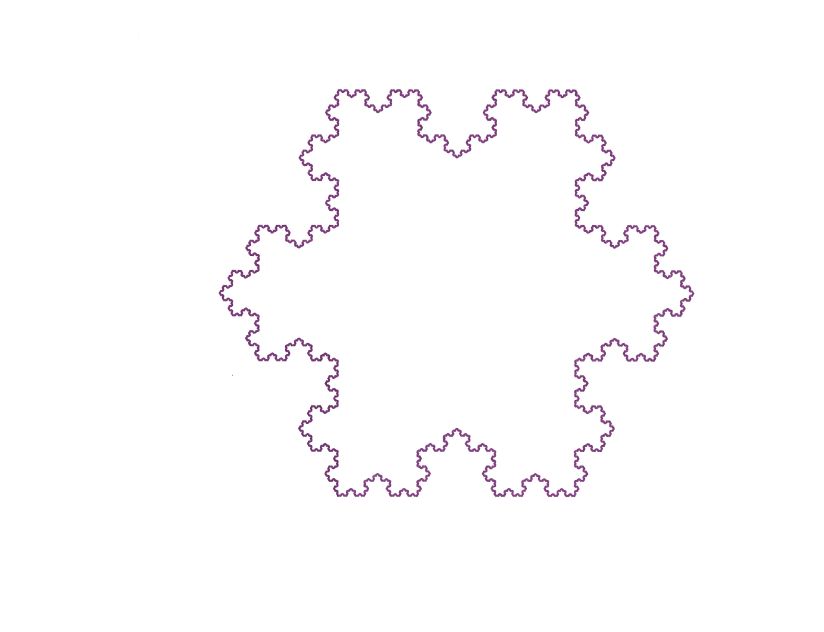
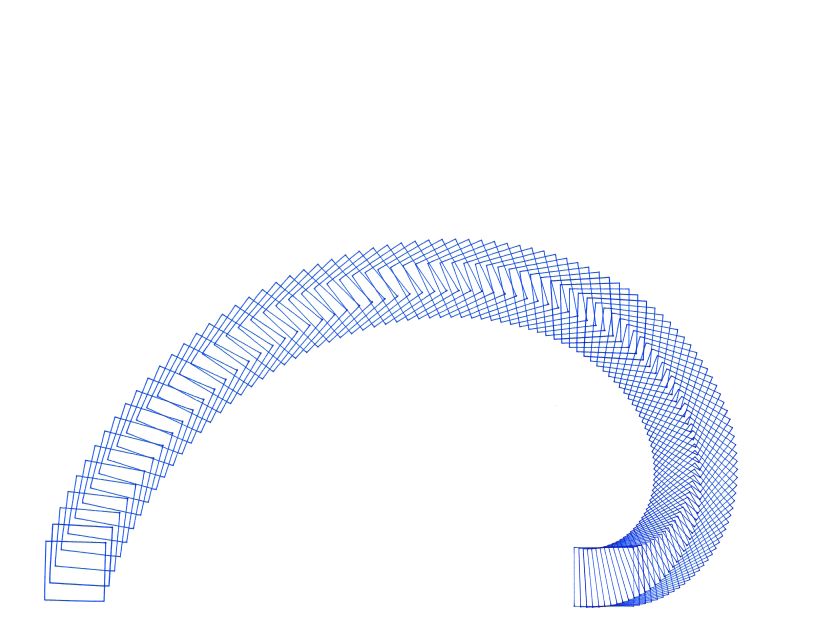
As for the HP-GL viewer? GhostPDL, by the makers of Ghostscript. You’ll have to build it from source, and its documentation isn’t quite where one might want it to be, but it implements a full HP PCL6Â / HP-GL/2 interpreter than can output bitmaps, PostScript or PDF. The SVG graphic below was made using the tools/plot2pdf.sh script to convert HP-GL to PDF, then I used ghostscript to convert that to SVG. Nifty!
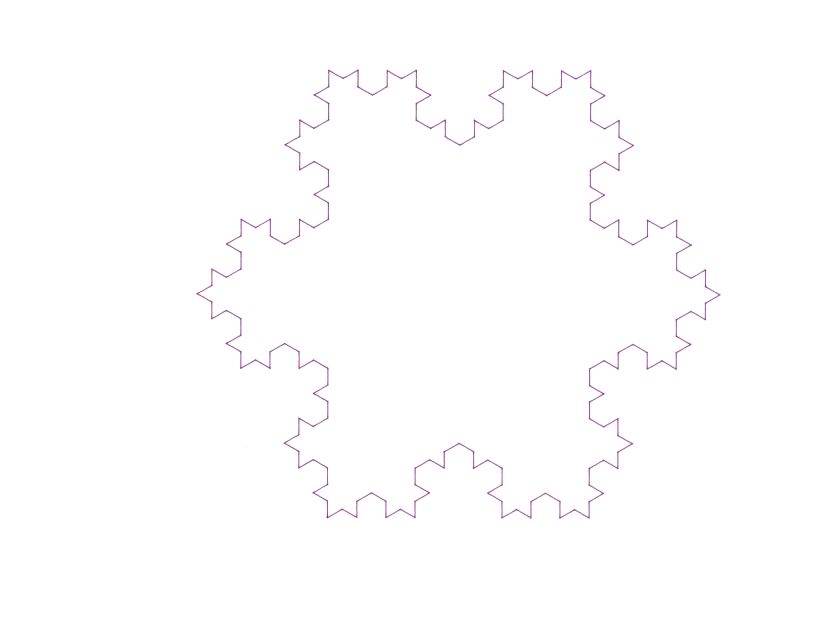
As a bonus, GhostPDL comes with one of the prettiest plotter fonts ever:
![[decorative] a spiralling figure made of scaled and rotated equilateral triangles](https://scruss.com/wordpress/wp-content/uploads/2025/04/hpgl-rotatey.png)
![[decorative] a spiralling figure made of scaled and rotated equilateral triangles](https://scruss.com/wordpress/wp-content/uploads/2025/04/20250408_214147_BRWD89C6730425A_000572a-787x1024.jpg)


