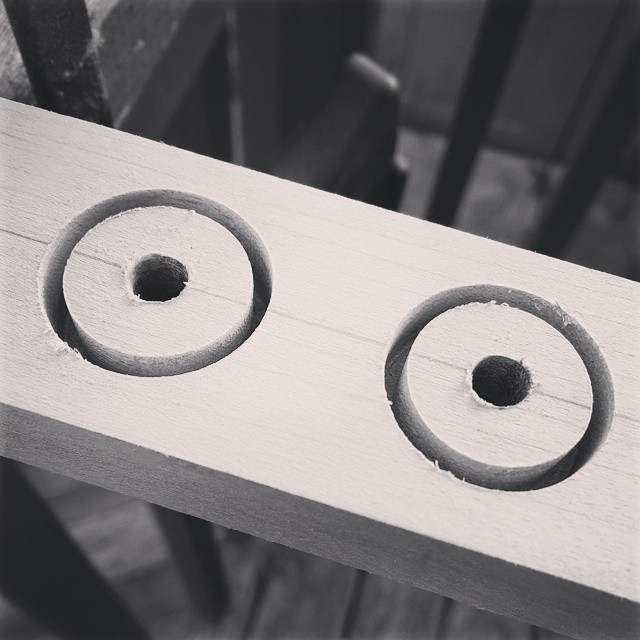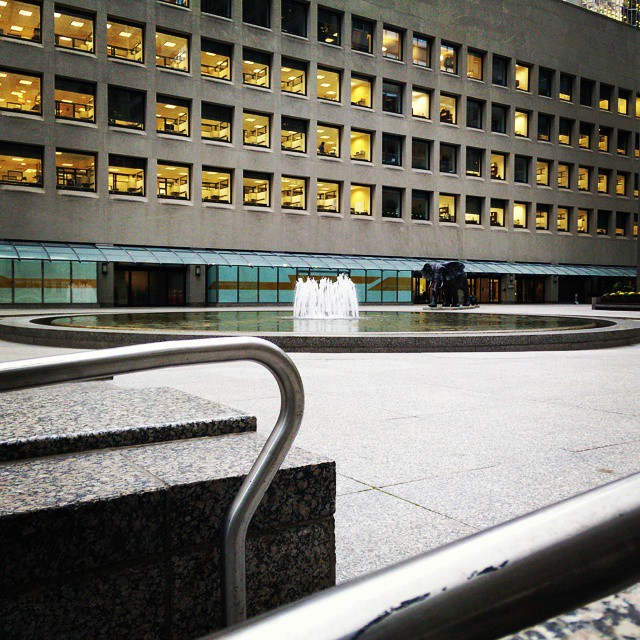

Instagram filter used: Lo-fi
If I wished to get a tattoo (which I don’t), I think it would have to be this: 
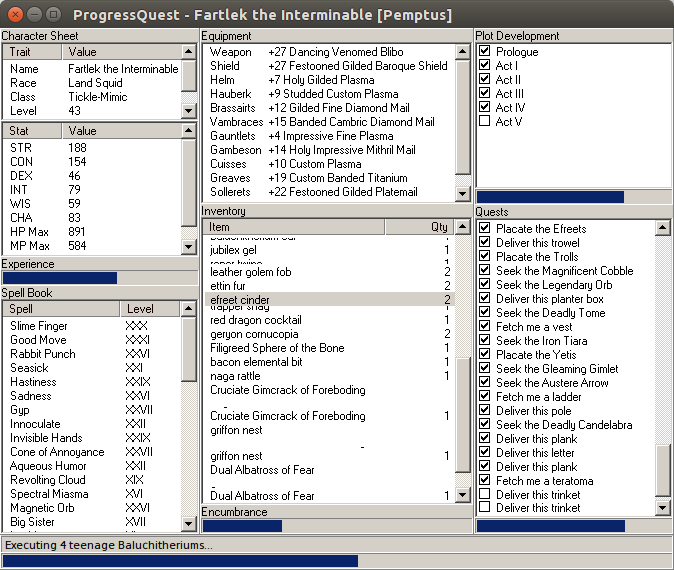 The display gets a bit mixed up under Linux, but Progress Quest is still delightful.
It also has some of the best Release Notes ever:
 Changes for version 6.1:     * I really just don't remember.     * I also don't see how it could matter much.
Fetch me a teratoma!
It’s the Canadian Electricity Association’s Electricity in Ontario week. Can’t you feel it in the air? A brochure, snappily titled “ELECTRICITY ARE WE GETTING VALUE FOR THE MONEY WE PAY?†[pdf] was in my dead tree media stack this morning. I think it’s trying to say our power is too cheap, as in this graph yoinked from the text:
 But as ever, hand-picked statistics only tell half the story. Digging into the IEA Key World Energy Statistics handbooks for 2011 and 2012, the data look something more like this:
|
Country |
2010 Domestic Electricity Price / USD/kWh |
2010 Annual Electricity Consumption per capita / kWh |
Annual Cost per capita |
|
Denmark |
$0.356 |
6,329 |
$2,255 |
|
Japan |
$0.232 |
8,399 |
$1,950 |
|
United Kingdom |
$0.199 |
5,741 |
$1,142 |
|
France |
$0.157 |
7,756 |
$1,216 |
|
United States |
$0.116 |
13,361 |
$1,547 |
|
Canada |
$0.095 |
15,145 |
$1,431 |
|
Mexico |
$0.089 |
2,085 |
$185 |
So really, because Canadians use such an obscene amount of energy per capita (srsly; we should be ashamed of ourselves), the graph should look more like this:
 So we’re not actually that inexpensive; solidly mid-range. Since our electricity price per kWh is so low, if we spent a little money on energy conservation, we could have really cheap power for everyone.
This guy sets up on the SE corner of Yonge & St Clair most afternoons, and plays endless variations on the above recording. He’s playing an autoharp with the chord bars removed, and run through a homebrew battery-powered amplifier with much reverb and distortion. A bunch of the burbly noises are 8kbit/s voice recorder artifacts from my phone.
Although the themes seem repetitive, I don’t think they repeat exactly every time. He seems to be in a happy place playing them.