Trolling the Bruce Nuclear Cost and Clean Air Calculator for Fun & Profit

Energy_Calculator-Bruce_Power
You might have seen the Bruce Power Cost and Clean Air Calculator. It’s supposed to show that nuclear is both cheap and clean, and using anything else would make your bills and your emissions go through the roof. Well, here are 40+ scenarios that all save money and emissions while using no nuclear and no coal:

  1. 3.9% Solar, 5.7% Wind, 0.2% Gas, 0% Nuclear, 90.2% Hydro and 0% Coal saves $5.09/month and 89.7 t/CO2 annually.
  2. 2.1% Solar, 10.1% Wind, 0.3% Gas, 0% Nuclear, 87.5% Hydro and 0% Coal saves $8.97/month and 89.2 t/CO2 annually.
  3. 0.5% Solar, 23.6% Wind, 0.4% Gas, 0% Nuclear, 75.5% Hydro and 0% Coal saves $2.75/month and 88.7 t/CO2 annually.
  4. 2.1% Solar, 2.5% Wind, 0.8% Gas, 0% Nuclear, 94.6% Hydro and 0% Coal saves $16.32/month and 87.1 t/CO2 annually.
  5. 3.1% Solar, 0.2% Wind, 1.4% Gas, 0% Nuclear, 95.3% Hydro and 0% Coal saves $13.27/month and 84.5 t/CO2 annually.
  6. 0.6% Solar, 5.4% Wind, 1.8% Gas, 0% Nuclear, 92.2% Hydro and 0% Coal saves $19.52/month and 82.7 t/CO2 annually.
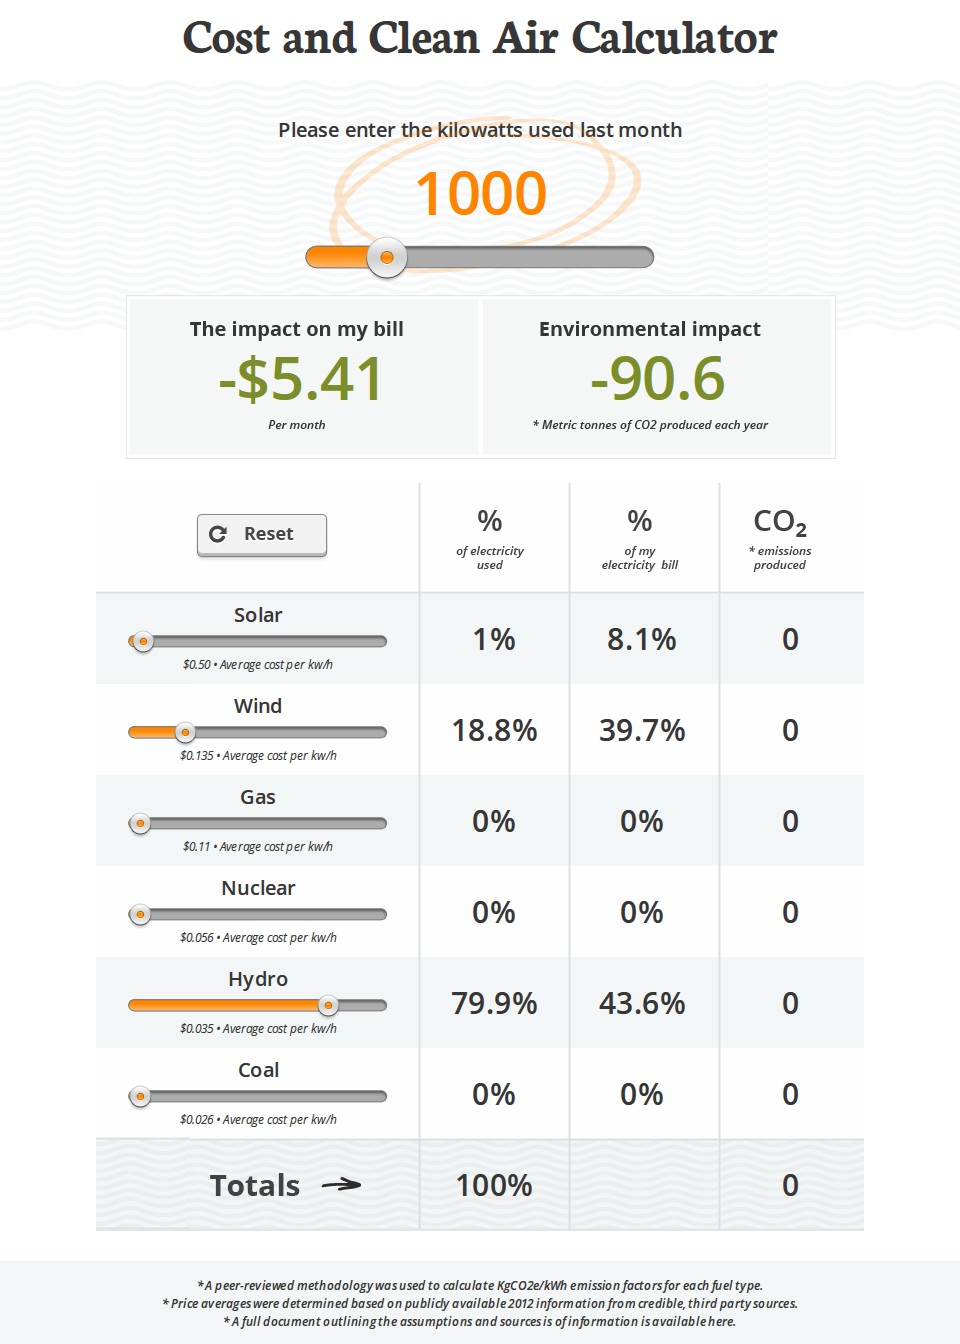
  7. 1.9% Solar, 15.8% Wind, 2.5% Gas, 0% Nuclear, 79.8% Hydro and 0% Coal saves $2.48/month and 79.8 t/CO2 annually.
  8. 0.3% Solar, 13.6% Wind, 2.5% Gas, 0% Nuclear, 83.6% Hydro and 0% Coal saves $12.08/month and 79.7 t/CO2 annually.
  9. 3.0% Solar, 11.7% Wind, 2.9% Gas, 0% Nuclear, 82.4% Hydro and 0% Coal saves $1.21/month and 78.0 t/CO2 annually.
  10. 0.1% Solar, 24.8% Wind, 3.1% Gas, 0% Nuclear, 72.0% Hydro and 0% Coal saves $1.35/month and 77.3 t/CO2 annually.
  11. 2.7% Solar, 4.8% Wind, 3.6% Gas, 0% Nuclear, 88.9% Hydro and 0% Coal saves $8.77/month and 75.2 t/CO2 annually.
  12. 4.1% Solar, 1.2% Wind, 3.9% Gas, 0% Nuclear, 90.8% Hydro and 0% Coal saves $5.96/month and 73.6 t/CO2 annually.
  13. 1.3% Solar, 0.3% Wind, 5.6% Gas, 0% Nuclear, 92.8% Hydro and 0% Coal saves $18.44/month and 66.3 t/CO2 annually.
  14. 2.4% Solar, 0.1% Wind, 6.0% Gas, 0% Nuclear, 91.5% Hydro and 0% Coal saves $13.26/month and 64.7 t/CO2 annually.
  15. 3.8% Solar, 4.6% Wind, 6.5% Gas, 0% Nuclear, 85.1% Hydro and 0% Coal saves $1.99/month and 62.2 t/CO2 annually.
  16. 1.4% Solar, 11.8% Wind, 6.8% Gas, 0% Nuclear, 80% Hydro and 0% Coal saves $5.54/month and 61.0 t/CO2 annually.
  17. 2.9% Solar, 5.7% Wind, 7.0% Gas, 0% Nuclear, 84.4% Hydro and 0% Coal saves $4.64/month and 60.1 t/CO2 annually.
  18. 0.6% Solar, 14.4% Wind, 7.6% Gas, 0% Nuclear, 77.4% Hydro and 0% Coal saves $6.09/month and 57.7 t/CO2 annually.
  19. 0.7% Solar, 12.1% Wind, 7.9% Gas, 0% Nuclear, 79.3% Hydro and 0% Coal saves $7.64/month and 56.4 t/CO2 annually.
  20. 2.1% Solar, 2.9% Wind, 8.5% Gas, 0% Nuclear, 86.5% Hydro and 0% Coal saves $104/month and 53.5 t/CO2 annually.
  21. 1.9% Solar, 13.5% Wind, 8.6% Gas, 0% Nuclear, 76.0% Hydro and 0% Coal saves $0.36/month and 53.1 t/CO2 annually.
  22. 2.5% Solar, 3.5% Wind, 8.6% Gas, 0% Nuclear, 85.4% Hydro and 0% Coal saves $7.63/month and 53.1 t/CO2 annually.
  23. 0% Solar, 5.4% Wind, 8.7% Gas, 0% Nuclear, 85.9% Hydro and 0% Coal saves $17.02/month and 52.9 t/CO2 annually.
  24. 0.5% Solar, 0.4% Wind, 8.8% Gas, 0% Nuclear, 90.3% Hydro and 0% Coal saves $19.53/month and 52.4 t/CO2 annually.
  25. 1.6% Solar, 3.9% Wind, 9.7% Gas, 0% Nuclear, 84.8% Hydro and 0% Coal saves $10.31/month and 48.5 t/CO2 annually.
  26. 2.6% Solar, 6.6% Wind, 9.9% Gas, 0% Nuclear, 80.9% Hydro and 0% Coal saves $2.76/month and 47.6 t/CO2 annually.
  27. 0.6% Solar, 9.6% Wind, 10.5% Gas, 0% Nuclear, 79.3% Hydro and 0% Coal saves $8.70/month and 45.2 t/CO2 annually.
  28. 1.4% Solar, 1.0% Wind, 10.5% Gas, 0% Nuclear, 87.1% Hydro and 0% Coal saves $13.58/month and 44.9 t/CO2 annually.
  29. 0.9% Solar, 12.1% Wind, 11.7% Gas, 0% Nuclear, 75.3% Hydro and 0% Coal saves $3.96/month and 39.9 t/CO2 annually.
  30. 0.4% Solar, 13.9% Wind, 12.6% Gas, 0% Nuclear, 73.1% Hydro and 0% Coal saves $3.89/month and 35.7 t/CO2 annually.
  31. 0.3% Solar, 10.7% Wind, 13.3% Gas, 0% Nuclear, 75.7% Hydro and 0% Coal saves $6.89/month and 32.9 t/CO2 annually.
  32. 0.3% Solar, 10.5% Wind, 13.3% Gas, 0% Nuclear, 75.9% Hydro and 0% Coal saves $7.11/month and 32.8 t/CO2 annually.
  33. 0.2% Solar, 17.8% Wind, 13.6% Gas, 0% Nuclear, 68.4% Hydro and 0% Coal saves $0.18/month and 31.8 t/CO2 annually.
  34. 2.3% Solar, 6.9% Wind, 14.0% Gas, 0% Nuclear, 76.8% Hydro and 0% Coal saves $0.96/month and 29.8 t/CO2 annually.
  35. 3.5% Solar, 0.2% Wind, 14.0% Gas, 0% Nuclear, 82.3% Hydro and 0% Coal saves $2.11/month and 29.7 t/CO2 annually.
  36. 0.6% Solar, 15.2% Wind, 14.0% Gas, 0% Nuclear, 70.2% Hydro and 0% Coal saves $0.68/month and 29.6 t/CO2 annually.
  37. 3.1% Solar, 3.4% Wind, 14.9% Gas, 0% Nuclear, 78.6% Hydro and 0% Coal saves $09/month and 26.0 t/CO2 annually.
  38. 2.2% Solar, 3.6% Wind, 16.8% Gas, 0% Nuclear, 77.4% Hydro and 0% Coal saves $2.65/month and 17.8 t/CO2 annually.
  39. 1.4% Solar, 1.3% Wind, 17.1% Gas, 0% Nuclear, 80.2% Hydro and 0% Coal saves $8.29/month and 16.2 t/CO2 annually.
  40. 1.1% Solar, 4.5% Wind, 18.2% Gas, 0% Nuclear, 76.2% Hydro and 0% Coal saves $5.74/month and 11.5 t/CO2 annually.
  41. 0.1% Solar, 13.3% Wind, 19.1% Gas, 0% Nuclear, 67.5% Hydro and 0% Coal saves $0.70/month and 7.9 t/CO2 annually.
  42. 0.1% Solar, 6.4% Wind, 19.8% Gas, 0% Nuclear, 73.7% Hydro and 0% Coal saves $7.47/month and 4.7 t/CO2 annually.
  43. 0.7% Solar, 8.7% Wind, 20.6% Gas, 0% Nuclear, 70% Hydro and 0% Coal saves $1.73/month and 1.2 t/CO2 annually.

Sure, some of these won’t be practical from a dispatch/capacity perspective, but hey, that’s Bruce’s issue to explain away.

I couldn’t have done it without this tiny routine to produce a list of random numbers that all add up to 1. No way was I clicking those sliders 10000+ times. Viewing the source was handy, though.

sub rndnormsum {
    # generate N uniformly distributed random numbers that sum to 1
    # see http://stackoverflow.com/a/2640079/377125
    my $n = shift;        # number of entries to return
    my @arr = ( 0, 1 );
    foreach ( 1 .. ( $n - 1 ) ) {
        push @arr, rand;
    }
    @arr = sort(@arr);
    my @result = ();
    foreach ( 1 .. $n ) {
        push @result, $arr[$_] - $arr[ $_ - 1 ];
    }
    return @result;
}

All the printers I’ve ever owned …

bird you can see: hp print test

  • An ancient (even in 1985) Centronics serial dot-matrix printer that we never got working with the CPC464. The print head was driven along a rack, and when it hit the right margin, an idler gear was wedged in place, forcing the carriage to return. Crude, noisy but effective.
  • Amstrad DMP-2000. Plasticky but remarkably good 9-pin printer. Had an open-loop ribbon that we used to re-ink with thick oily endorsing ink until the ribbons wore through.
  • NEC Pinwriter P20. A potentially lovely 24-pin printer ruined by a design flaw. Print head pins would get caught in the ribbon, and snap off. It didn’t help that the dealer that sold it to me wouldn’t refund my money, and required gentle persuasion from a lawyer to do so.
  • Kodak-Diconix 300 inkjet printer. I got this to review for Amiga Computing, and the dealer never wanted it back. It used HP ThinkJet print gear which used tiny cartridges that sucked ink like no tomorrow; you could hear the droplets hit the page.
  • HP DeskJet 500. I got this for my MSc thesis. Approximately the shape of Torness nuclear power station (and only slightly smaller), last I heard it was still running.
  • Canon BJ 200. A little mono inkjet printer that ran to 360dpi, or 720 if you had all the time in the world and an unlimited ink budget.
  • Epson Stylus Colour. My first colour printer. It definitely couldn’t print photos very well.
  • HP LaserJet II. Big, heavy, slow, and crackling with ozone, this was retired from Glasgow University. Made the lights dim when it started to print. Came with a clone PostScript cartridge that turned it into the world’s second-slowest PS printer. We did all our Canadian visa paperwork on it.
  • Epson Stylus C80. This one could print photos tolerably well, but the cartridges dried out quickly, runing the quality and making it expensive to run.
  • Okidata OL-410e PS. The world’s slowest PostScript printer. Sold by someone on tortech who should’ve known better (and bought by someone who also should’ve known better), this printer jams on every sheet fed into it due to a damaged paper path. Unusually, it uses an LED imaging system instead of laser xerography, and has a weird open-hopper toner system that makes transporting a part-used print cartridge a hazard.
  • HP LaserJet 4M Plus. With its duplexer and extra paper tray it’s huge and heavy, but it still produces crisp pages after nearly 1,000,000 page impressions. I actually have two of these; one was bought for $99 refurbished, and the other (which doesn’t print nearly so well) was got on eBay for $45, including duplexer and 500-sheet tray. Combining the two (and judiciously adding a bunch of RAM) has given me a monster network printer which lets you know it’s running by dimming the lights from here to Etobicoke.
  • IBM Wheelwriter typewriter/ daisywheel printer. I’ve only ever produced a couple of pages on this, but this is the ultimate letter-quality printer. It also sounds like someone slowly machine-gunning the neighbourhood, so mostly lives under wraps.
  • HP PhotoSmart C5180. It’s a network photo printer/scanner that I bought yesterday. Really does print indistinguishably from photos, and prints direct from memory cards. When first installed, makes an amusing array of howls, boinks, squeals, beeps and sproings as it primes the print heads.

This wind study brought to you by the Canadian Nuclear Association

So there’s a new report on wind integration in Canada, written by The Conference Board of Canada. People are picking up on it, and even the doughty Refocus quotes… electricity from onshore wind is uneconomic in comparison with traditional alternatives“. Hmm.

So I read the report, and what do I find in the Preface?

As part of an ongoing initiative to investigate energy policy options and the future of the Canadian energy system, the Canadian Nuclear Association contracted The Conference Board of Canada to conduct a comparative study of various countries’ experiences with supporting and implementing large-scale wind projects.

So we’re expected to believe that the CNA would wish to have an objective and non-partisan report written on wind power, eh?

Debunking the 25% Myth

My dad called yesterday, asking, “Wind turbines do run for more than 25% of the time, don’t they?”. Seems he read an opinion piece in his favourite fair ‘n’ balanced rag (The Telegraph) that said that wind turbines only run 25% of the time.

I see this factoid popping up more and more from the anti-wind crowd. It’s a particularly difficult one to refute in the press, as by the time you’ve tried to explain the difference between capacity factor and operation time, you’ve lost them. Or gone over your allotted time/word count, at least.

I’ve got a year’s production data from WindShare/Toronto Hydro‘s turbine in front of me. It’s on a marginal site, one that probably wouldn’t be developed by a commercial entity. So, does it run for more than 25% of the time?

Yes; the turbine is generating 63% of the time. I’ve defined generating as providing a net export of power to the grid. Our turbine’s a bit more cranky than most, and I have a suspicion that our metering system is dropping some production, but even so, 63% is way more than the claimed 25%. So it gives me great pleasure to say:

MYTH: Wind turbines only run for 25% of the time.
BUSTED! Wind turbines run at the very least 60% of the time, usually more.

(I can’t guarantee that Country Guardian won’t quote me out of context. I could make a cheap shot about not blaming them for their paymasters in the nuclear industry requiring value for money, but I won’t …)

there is no nuclear revival

Nuclear Power’s Scorned Small-Scale Competitors Are Walloping It in the Marketplace (PDF-100k)
Lovins Debunks the Notion That Nuclear Energy is the Best Investment Against Carbon Dioxide Emissions and Global Climate Change

Snowmass, Colorado, June 20, 2005 — Rocky Mountain Institute researchers today doused the hype about “nuclear revival” in an icy bath of real-world data. They documented that worldwide, the decentralized, low- or no-carbon sources of electricity — cogeneration and renewables, all claimed by nuclear advocates to be too small and too slow to help much with climate change — are already bigger than nuclear power and are quickly leaving it in the dust.

4 beeeeeeeeeeeellion dollars?!

Yup, it’ll cost $4,000,000,000 to restore the Pickering nuclear power station to full operation. Oh, and five years, too. And all because of bungling management.

This isn’t just a day late and a dollar short. In 1997, the refurb was estimated at $780m and five years. Now, they’re saying more than 5× the cost and twice the time. Someone please nominate ousted OPG chair Bill Farlinger — author of such classics as The Commonsense Revolution and How to Privatize Hydro for Fun & (my) Profit — for the Giller Prize, since it’s Canada’s Premier Literary Prize for Fiction.

Look, I’ll make Ontario a deal. Give me the CAD 4bn, and I’ll give you enough renewable energy to make Pickering history. And I’ll only bungle on my own time. Deal?