Not sure I entirely agree, but Low-tech Magazine: Urban windmills harm the environment.
Category: Wind Things
International panel of experts conclude sound from wind turbines has no harmful effect on human health
Wind Turbine Sound and Health Effects: An Expert Panel Review [PDF]
Executive summary:
People have been harnessing the power of the wind for more than 5,000 years. Initially used widely for farm irrigation and millworks, today’s modern wind turbines produce electricity in more than 70 countries. As of the end of 2008, there were approximately 120,800 megawatts of wind energy capacity installed around the world.
Wind energy enjoys considerable public support, but it also has its detractors, who have publicized their concerns that the sounds emitted from wind turbines cause adverse health consequences.
In response to those concerns, the American and Canadian Wind Energy Associations (AWEA and CanWEA) established a scientific advisory panel in early 2009 to conduct a review of current literature available on the issue of perceived health effects of wind turbines. This multidisciplinary panel is comprised of medical doctors, audiologists, and acoustical professionals from the United States, Canada, Denmark, and the United Kingdom. The objective of the panel was to provide an authoritative reference document for legislators, regulators, and anyone who wants to make sense of the conflicting information about wind turbine sound.
The panel undertook extensive review, analysis, and discussion of the large body of peer-reviewed literature on sound and health effects in general, and on sound produced by wind turbines. Each panel member contributed a unique expertise in audiology, acoustics, otolaryngology, occupational/ environmental medicine, or public health. With a diversity of perspectives represented, the panel assessed the plausible biological effects of exposure to wind turbine sound.
Following review, analysis, and discussion of current knowledge, the panel reached consensus on the following conclusions:
- There is no evidence that the audible or sub-audible sounds emitted by wind turbines have any direct adverse physiological effects.
- The ground-borne vibrations from wind turbines are too weak to be detected by, or to affect, humans.
- The sounds emitted by wind turbines are not unique. There is no reason to believe, based on the levels and frequencies of the sounds and the panel’s experience with sound exposures in occupational settings, that the sounds from wind turbines could plausibly have direct adverse health consequences.
but no autotuning
I gave my Wind Energy for the Perplexed (2009 remix) talk for the Kingsway PEO on Friday. Lots of industry folks were there.
The Myth of the Sudbury Wind Hot-Spot
When I was first involved in the industry in Ontario, every developer had a monitoring tower in Sudbury. Sudbury was going to be the wind energy capital of Canada. And then, suddenly, it wasn’t.
This is a half-remembered summary of a talk given by Jim Salmon at CanWEA 2009. I’m sure I’m missing bits, but the proceedings will come out eventually.
The first wind map of Canada, published in the early 1990s, showed phenomenal wind speeds over Sudbury. We’re talking wind-over-open-water speeds. The weather station at Sudbury airport could pretty much have been a wind farm.
Sudbury, for those that don’t know, is the centre of Ontario’s nickel mining. The city used to be ringed by huge smelters that pretty much did for any trees growing in the area. Sudbury was often described as a moonscape; NASA was rumoured to have trained there for moon landings. The landscape was barren and rocky in summer, and snow covered in winter. You can still see the effect (in satellite photos, at least) around Wawa, where the smelters have carved a huge plume in the trees.
One of the factors that affects wind speed in a location is surface roughness. The smoother the ground, the less the wind is slowed down by it. That’s why we’ve been working on offshore wind; water’s good and smooth.
So, back to Sudbury wind speeds. When wind energy developers first put towers up there in the late 1990s, the results were disappointing. When the measured wind speeds were compared to the current values from local weather stations, they seemed to correspond – but were much lower than the long-term record.
Here’s a quick and dirty graph, derived from Canada’s National Climate Archive data for all the Septembers from 1959 to 2008:
 (there’s no particularly good reason for me to have chosen September, except that it saved me downloading 12x as much data from the MSC website.)
The trend is clearly down. There are two likely linked causes:
- The smelters have cleaned up their emissions; back in the 1950s and 1960s, no-one much cared if you wrecked the landscape. (Hey, I remember my parents saying that the chlorine from the Fort William smelter used to turn Ben Nevis yellow in summer). These emissions may also have been reduced through reduced activity at the plants.
- Sudbury and the surrounding area has replanted many of the trees that were lost, because the conditions are acceptable for them to grow again. These are now of a reasonable size, and greatly affect the overall surface roughness of the area.
So, less emissions → more trees → less wind. Who knew?
(Jim’s presentation also included a section on how a lake near Sudbury was seen to be cooling over the years. The explanation was that, with reduced wind speeds, water mixing was reduced, so the cold water at the bottom stayed in its layers instead of being moved up to the surface and warmed.)
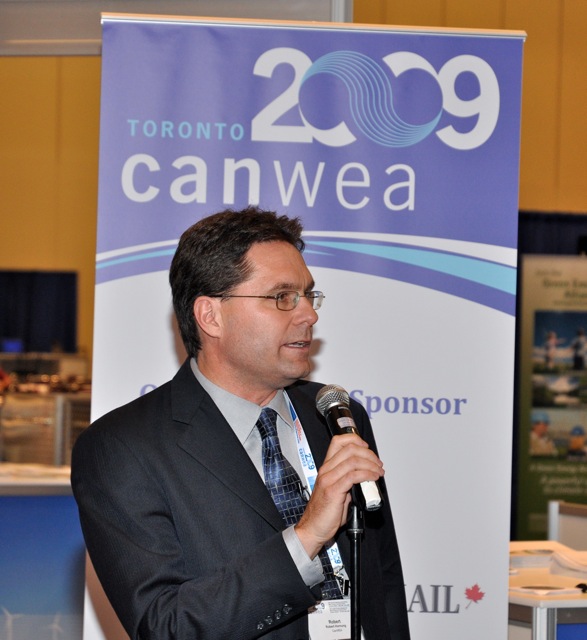
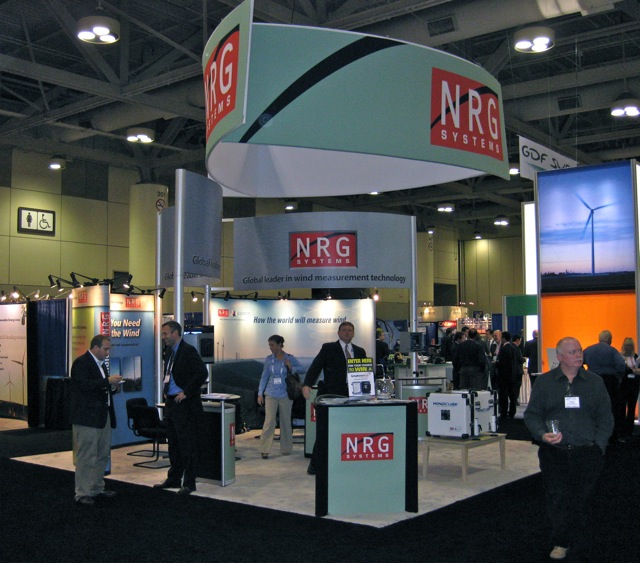
CanWEA 2009
I’m probably supposed to be on my way to the opening do, but I thought I’d post before it got too busy.
CanWEA 2009: Infinite Possibilities opened last night. Though attendance is up from last year, I think more people are coming into town today. It’s going to be a big event.


Energy Saving Trust’s field trial of domestic wind turbines
The Energy Saving Trust field trial of domestic wind turbines pretty much calls time on rooftop wind on the UK. Paul Gipe is less than impressed with the content and findings of the report.
Windsave, gone
Green energy revolution sours for Scots roof windmill maker – Herald Scotland | Business | Corporate & SME
Windsave, the high-profile Scottish developer of the ‘roof windmill’, has gone into liquidation
Wind Turbine Transport | LEGO® Exclusives | LEGO Shop
The Wind Turbine Transport will have to do until I get a 4999 from Vestas …
(thanks, Paul!)
slim pickens
Transmission Holding Back Not Only Pickens’ Plans But All US Wind – Renewable Energy World
This week, T. Boone Pickens announced that his plans to build the US $10 billion, 4,000-megawatt, Pampa Wind project are on hold. He cited lack of available transmission and funding concerns as the reason for the scale back.
Wait, hang on here … I thought that the Pickens Plan was all about the having the guts and the go (and the $$) to build transmission to make it work. Guess it was just a gas play after all.
Whitelee

neater meter
My folks got this quite nifty meter free from their utility:

It’s also fun to be back, and be able to see Whitelee wind farm from all around.
Update: seems like it’s the Classic meter from Current Cost.
Wind Knitting Factory
This is quite nifty, in a not-tremendously useful way: SHOW RCA Wind Knitting Factory. But then, it’s an art installation. It’s not meant to be useful.
Global Wind Day
Today is Global Wind Day. See if there are any events near you.
indoor windmill

the nearest, uh, wind things to my house
Are on and by the garguntuan new Zellers:
 I hesitate to call them wind turbines, as they are pretty dismally sited. Doubt they’ll generate much. There’s also a wee solar array next to them.
bellamania
Bellamy calls for more sea power
Apparently, David Bellamy said that “if people wanted to help combat climate change they should wear an extra layer of clothing in winter”. Uh, what?
nine in the bed, and the little one said …
I don’t know if this is worth posting to RISKS:
I used to manage wind farm SCADA systems. The supplier is a market leader in the wind industry. The components used to feed data to the central SCADA are industry standard, accurate, reliable units. The complete cost of the SCADA system and associated metering probably runs into the hundreds of thousands of dollars. This isn’t el cheapo stuff, and is put together by knowledgeable engineers and technicians.
So I was a little surprised to see that the generation report for a wind farm was showing a total of -8.3 GWh, when a similar wind farm nearby had generated 1.8 GWh for the same period. What!? Crossed wires on the meter? Inconceivable!
No wires were harmed in the making of this error. For metering power delivered, power plants use interval meters, which behave extremely similarly to your household electrical meter. They’re a little more accurate, have a few more features (like these ones have ethernet ports for remote reading) but they’re basically the same: any energy that goes through the wires gets added up on a counter. Take two readings a known time apart, subtract the later from the earlier, and you’ve got the total energy delivered.
The wind farm’s SCADA polls this meter every ten minutes, and stores the result in its database. When you want a generation report, the server goes through the data, subtracts the last reading from the first, and presents that as the generation. Simple; what could go wrong?
The bods at Major Wind Turbine Company were baffled. I was confused, and a little annoyed as I had lender and a board of directors breathing down my neck for revenue numbers. So I dug into the raw ten-minute data, and found this:
| kWh Delivered | |||
| Wind Farm A | Wind Farm B | ||
| T=0 | 9523886 | 9999237 | |
| T+10 min | 9525238 | 575 | |
| Difference | 1352 | -9998662 | |
It doesn’t take a genius to realise that the meter at Wind Farm B rolled over at 9,999,999 kWh, and so should really have read 10,000,575 kWh. The poor little SCADA didn’t know to check for rollover, and happily subtracted the later number from the earlier.
I should add that there was no risk to public safety or system operation caused by this error. Just a few lost hairs from me.
(Actually, many years ago, I had access to the source of an extremely early wind farm SCADA server. It was written by a series of summer students, with variable names and comments in their native language. It was pretty hard to follow. One little nugget I did pry out of the code was that they used a simple arithmetic mean for averaging wind direction. That meant that it took the mean of 358° and 2° to be 180°; not so smart …)
a little bit on the toronto offshore wind farm and the Hélimax study
Many people (such as 1, 2, 3, 4) cite the Hélimax study Analysis of Future Offshore Wind Farm Development in Ontario [PDF] as a good reason not to even measure wind speeds off the Toronto shoreline. I would be quite surprised if most commenters had read it, as it’s not a light read, but there are three basic reasons that the report doesn’t apply:
- The report is not prescriptive; it does not outline the only viable sites in the Great Lakes. Indeed, the very last paragraph of the executive summary says “… it should be emphasized that the sites … selected do not necessarily correspond to the projects currently being developed. This report by no means seeks to disparage any sites currently under development which are not part of the 64 sites selected. There are wind power projects that can be feasibly developed beyond the sites that are identified in the present study.” A statement like that leads me to believe that the report was intended for capacity planning, and not site selection.
- The report specifically excludes Lake Ontario around the GTA on population density, even though it notes “… utilities generally prefer to have power generation close to population centres” [p.10]. Simply put, if Toronto Hydro wishes to bring wind power into Toronto, it can either have local generation where everyone sees it, or remote generation with pylons that everyone can see. Pick one.
- The mesoscale modelling that the report relies upon is unproven offshore: “… the accuracy of mean wind speeds derived from onshore mesomaps is generally assumed to be ±7%, the precision of such maps for offshore applications is not well known” [p.4]. ±7% for a mean wind speed means a lot more than seven percent in energy yield – that’s roughly good enough to tell you where you might want to start doing site selection. Indeed, the report confirms this: “… on-site meteorological measurements are required to perform a truly judicious assessment of the local wind resource and ensuing energy yields of a given site”.
So that about wraps it up for the Hélimax study pertaining to Toronto.
Others have commented that the low capacity factors of the Pickering and ExPlace turbines. Despite that fact that capacity factors for a given site are highly machine specific, there are some issues here too:
- Both sites are near large buildings which disrupt air flow. This issue goes away even a moderate distance offshore.
- Both sites are really demonstrators, and positioned for maximum public exposure rather than generation.
- The Pickering Vestas V80 was a very early model of its type, and needed a lot of TLC to get operating. I wouldn’t call it quite a prototype, but it’s not far off.
- The Pickering turbine is designed for windy (Class I) sites. It has shorter blades (80m diameter) and a bigger generator (1.8MW) than the turbines I’m most familiar with (82m diameter, 1.65MW). It will catch less wind and thus drive the generator less hard (quick, you come up with a better analogy for capacity factor … I couldn’t) than a Class II or III machine.
- The Explace turbine has smaller blades than it was supposed to – the supplier ceased trading before they were able to replace the interim 52m blade set with 58m ones. As the tower was designed for longer blades, the turbine can never be run at full speed or full generation.
- Due to the closure of Lagerwey, the ExPlace turbine has never had what I’d class as an industry-standard maintenance contract. The joint venture of TH and WindShare volunteers directs the maintenance, but there’s no permanent crew like a commercial operation would have.
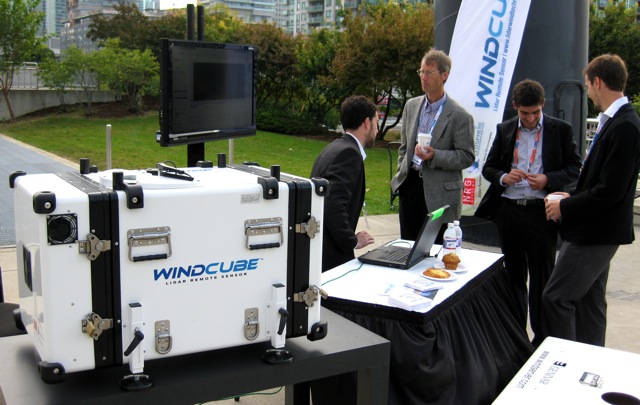
So put that lidar out in the lake, and let’s see what we’ve got.
few ties are awesome – this one just might be
 Question is, would I splash $95 on a Nicole Miller silk tie, or just soup?